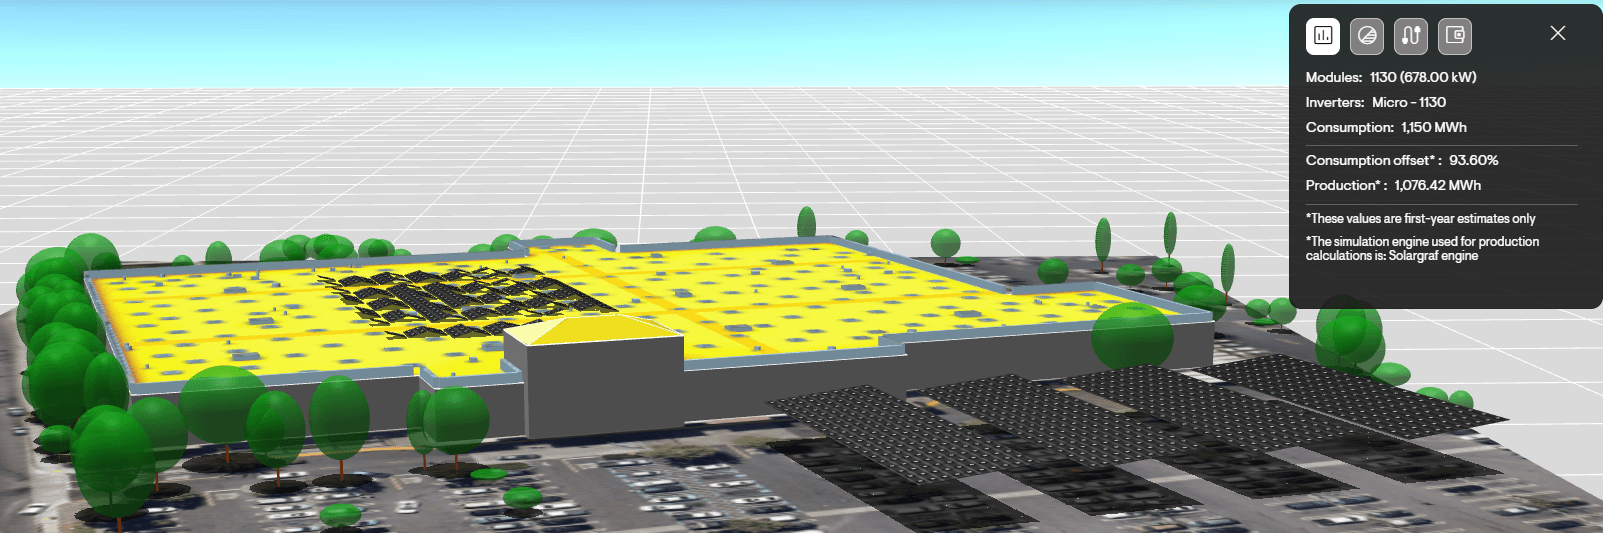
Solargraf's production engine has been independently validated by the National Laboratory of the Rockies (NLR) (formerly the National Renewable Energy Laboratory (NREL)), with results that are comparable to NLR's own System Advisor Model (SAM).
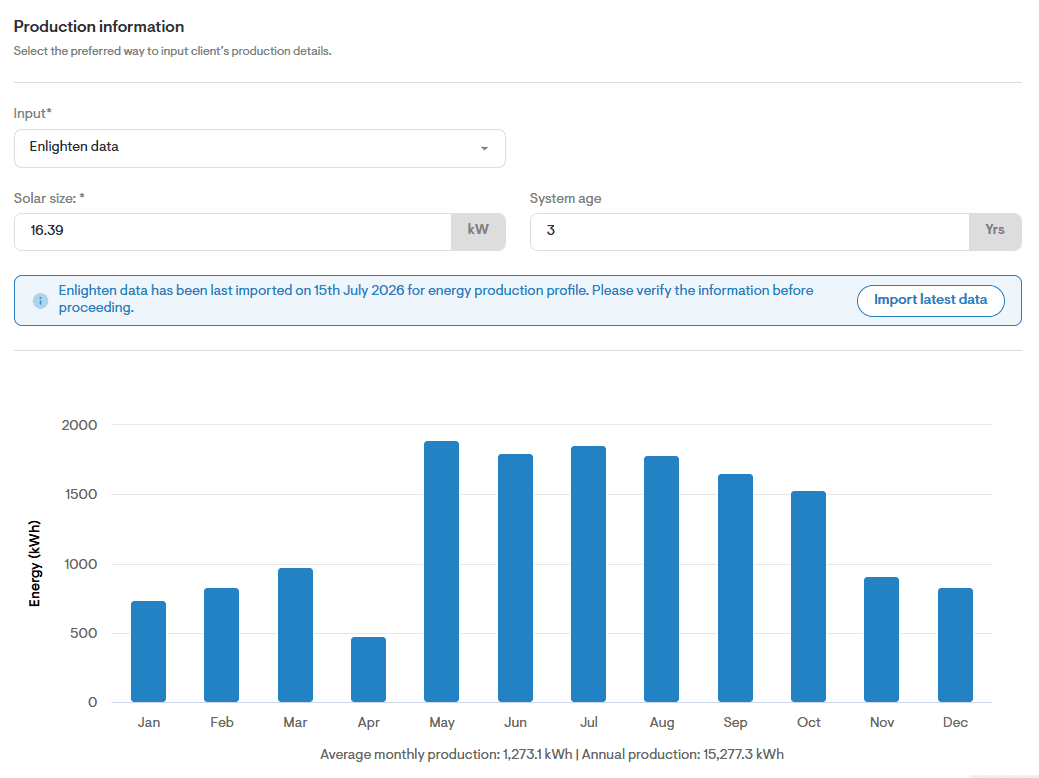
Every solar proposal rests on one number: how much energy the system will produce. Installers use that figure to size systems, set customer expectations and calculate savings, so the accuracy of the underlying production model matters. NLR recently put Solargraf's production engine to the test by comparing its predictions with real, measured system performance.
Solargraf's production engine
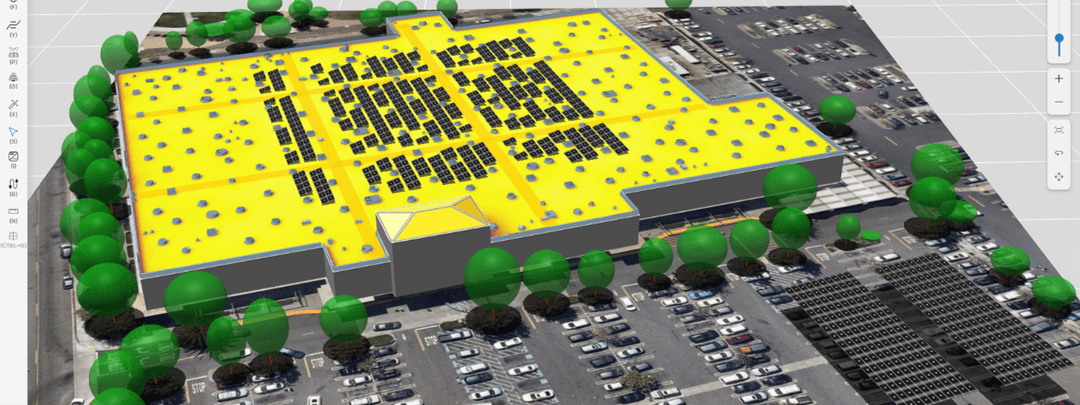
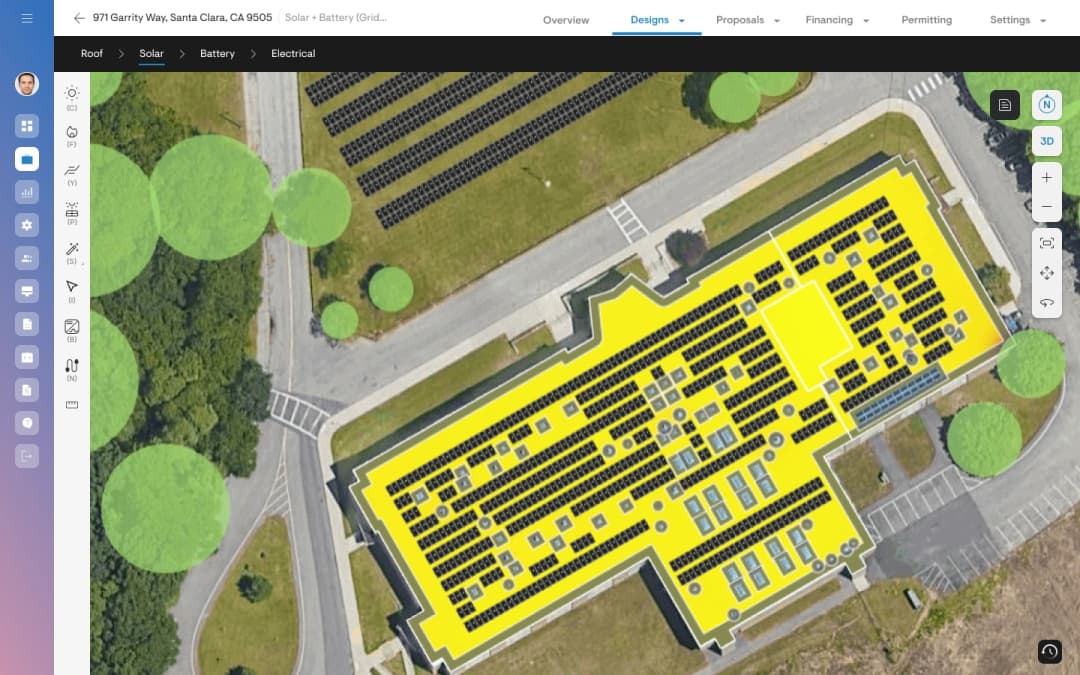
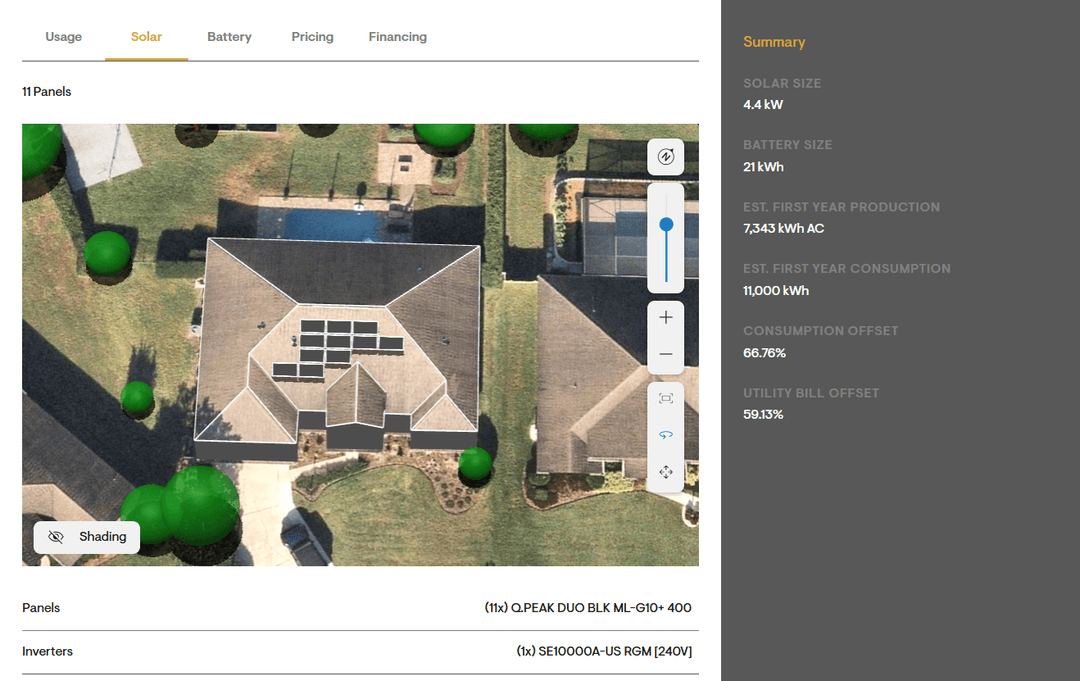
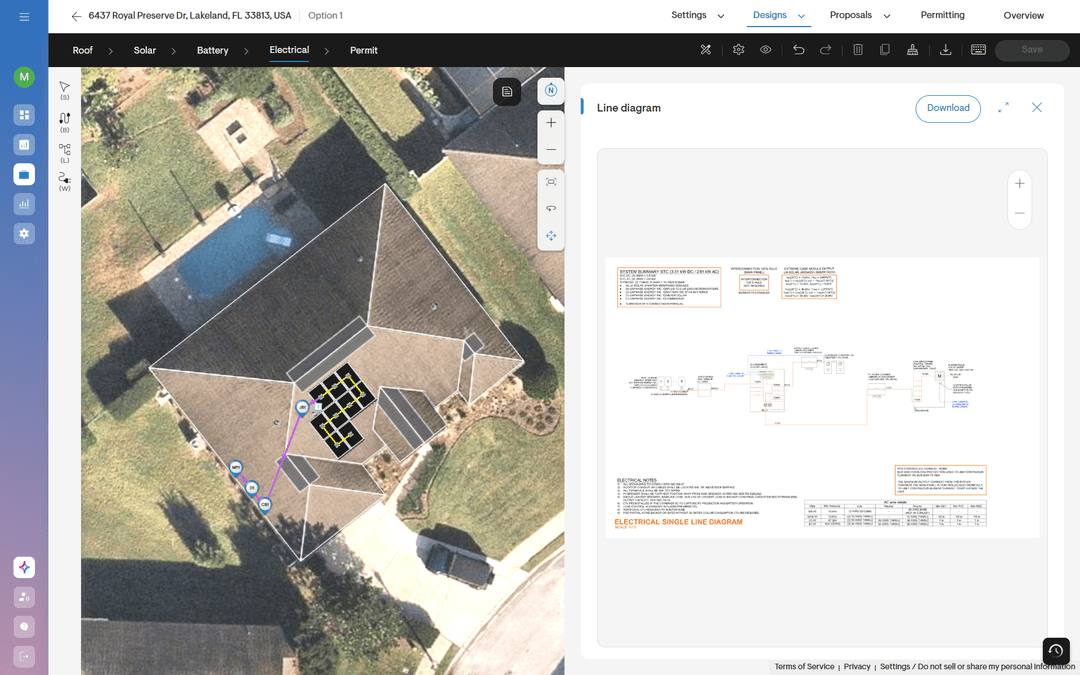
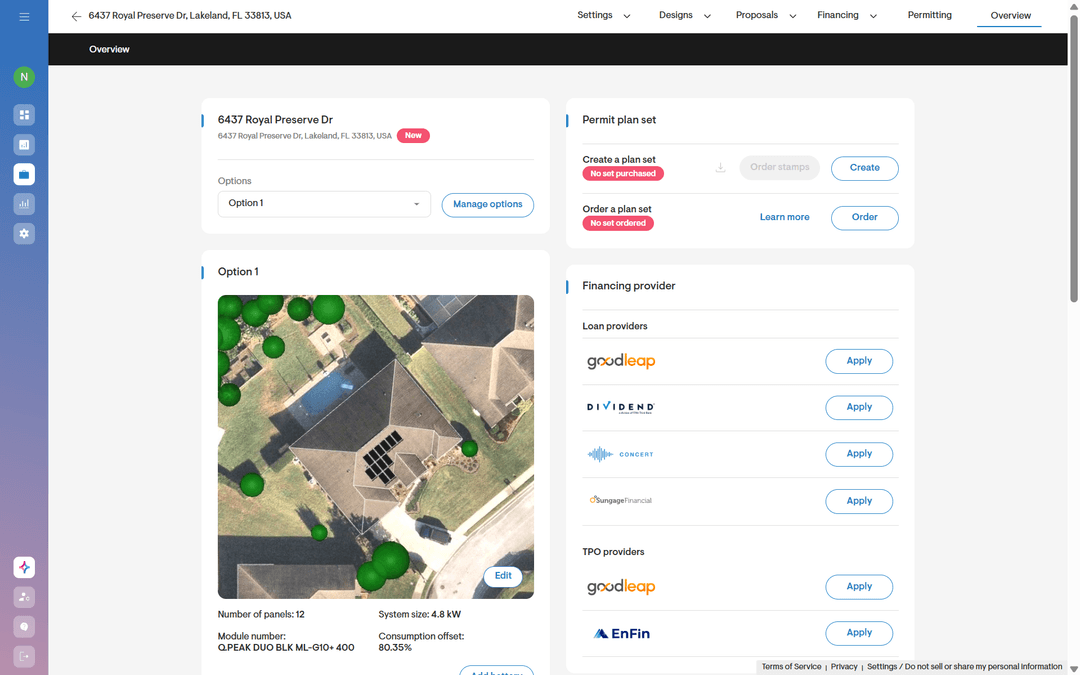
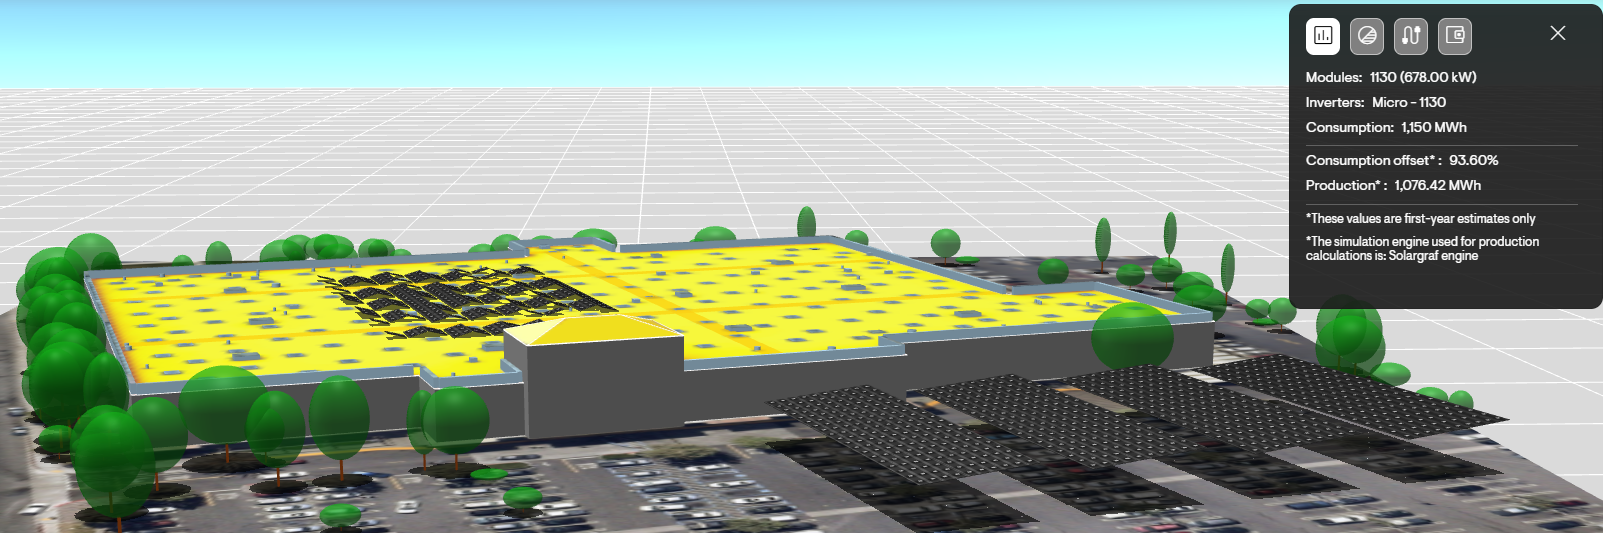
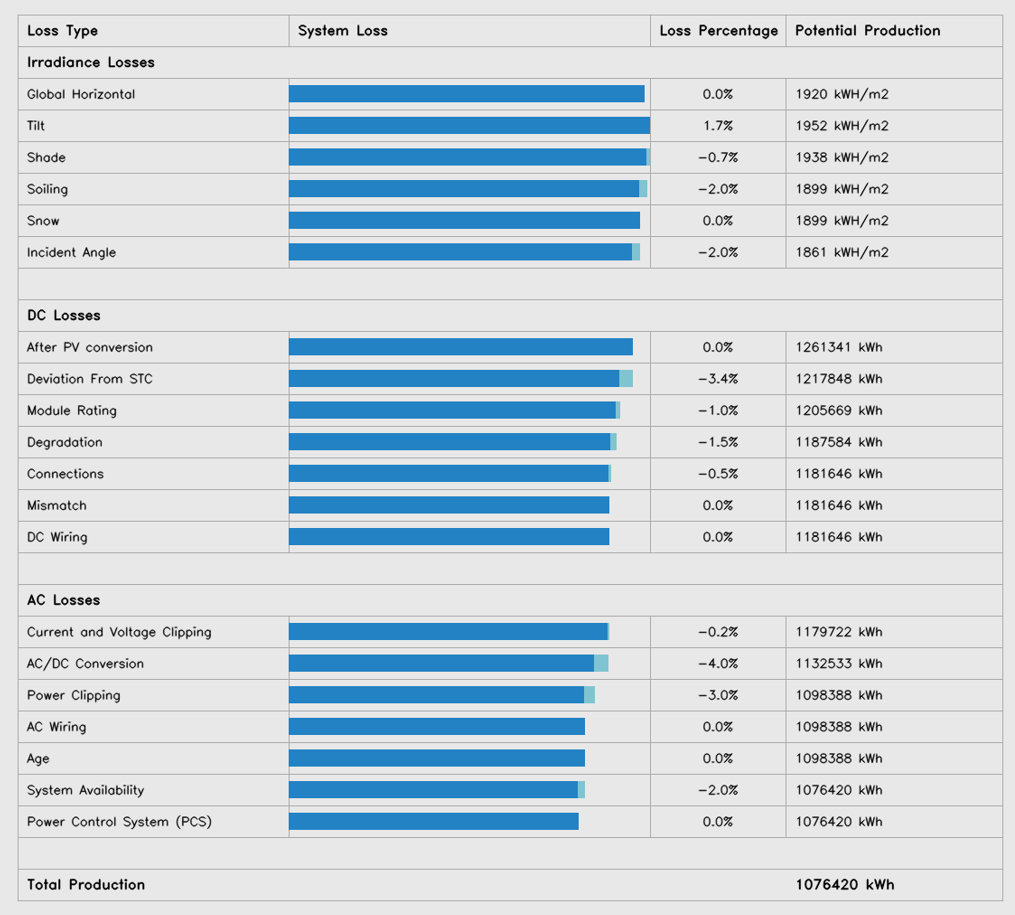
Solargraf is a cloud-based 3D design tool that models roof pitch, azimuth, height, walls, obstructions, trees and more. Its production estimates combine several layers of technology. Irradiance is computed from weather data using Solargraf's own in-house engine handles DC and AC computation. That engine uses IV curves generated at the module or submodule level. Solargraf's Shading Engine adds the effect of shading from nearby obstructions and other roof facets.
About NLR
The National Renewable Energy Laboratory (NREL) is the U.S. Department of Energy's primary laboratory for renewable energy and energy efficiency research. NREL is now known as the National Laboratory of the Rockies, and the report is published under that name. For decades its researchers have validated PV modeling tools against measured data, including SAM and other industry tools.
NLR's evaluation: Solargraf vs. measured performance
Methodology
As part of a Cooperative Research and Development Agreement (CRADA) between Enphase Energy and NLR, NLR experts modeled three fixed-tilt PV systems from NLR's South Table Mountain campus in Solargraf:
- A 94 kW roof-mounted system
- A 408 kW roof-mounted system
- A 525 kW carport system
NLR compared Solargraf's predicted output with measured production data from 2011 and 2012. The same systems were also modeled in SAM to benchmark Solargraf against another widely used modeling tool. The evaluation followed the same methodology NLR has used to verify other PV modeling tools. Default loss assumptions were used in both tools, reflecting the level of information many Solargraf users have when they build a design.

Results
| Metric | Solargraf | SAM |
| Annual error of prediction | -3.9% to -1.3% | -3.7% to -0.7% |
| Hourly normalized RMSE | 2.9% to 4.7% | See report |
NLR found that Solargraf's annual error fell within the range of tools examined in its previous validation studies. Both tools showed the same seasonal pattern in monthly error, with winter months trending toward overestimation relative to summer months. This is consistent with earlier NLR validation studies.
Summary
NLR's validation shows that Solargraf's production predictions are comparable with SAM, one of the industry's most established modeling tools. For installers, this means the production numbers in your Solargraf proposals rest on modeling that has been checked against real-world system performance by an independent national laboratory. That gives you confidence in the figures you put in front of customers, and gives your customers a quick, precise solution to their solar and storage needs.
The original report, Validation of Photovoltaic Modeling Tool Solargraf Against Measured Data, is available on the NRL website. You can access it here.
Boost your solar success: Get a custom, validated-accuracy solar proposal today.
Want to know more?
Join our upcoming webinar to dive deeper into our enhancements.
Schedule a demo for a personalized walkthrough on understanding how Solargraf can add value to your business.
Thank you for being part of our growing community; we can’t wait to show you what’s next.