
Overview
The system visualizer feature allows designers and sales teams to visualize the sun’s movement across the sky and understand how shading changes throughout the day and year. This includes real-time shadows cast by roof structures, obstructions and trees.
Feature details
In the design tool
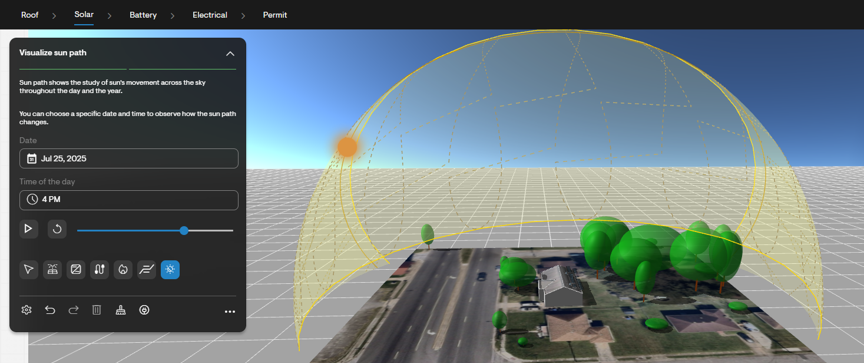
Note that as of April 2026, the system visualizer animation is only available to users of the “guided” design experience. Within the solar design tab, there is an icon labeled “Visualize sun path”. Selecting this will enable the sun path animation.
While this tool is selected, a menu appears, where the user can define the day of the year and time of the day for which they’d like to see the sun’s position. The user may alternatively select the “play” button to simulate the sun moving across the sky throughout the selected day. The sun moves in a 24-hour cycle, moving one hour per second.
As the sun’s position updates, so do the shadows cast by objects such as roof facets, obstructions and trees. Identifying where shadows are cast at various times of the day, and on various days of the year, helps to illustrate why panels are placed in certain locations – and why other locations are kept clear. This is especially important in areas like California, with time-of-use utility tariffs dictating that solar production is especially valuable at specific hours of the year.
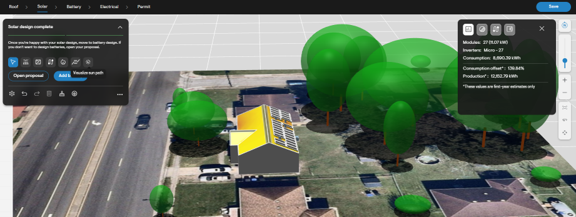
On the proposal
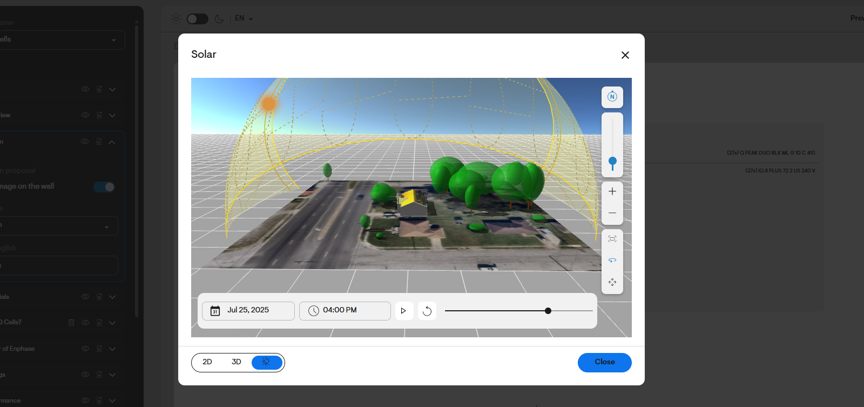
Within the design section of the web version of the proposal, users can expand the design to view it in greater detail.
Within the dialog that opens, the user can switch between 2D and 3D views of design. With the 3D view selected, the user can also enable the system visualizer using the third icon.
This allows salespeople to showcase the sun’s path – and the impact of shadows – without needing to navigate away from the proposal.
Why it matters
Visualizing the sun’s position – and the shadows it casts – at various times of the year helps to inform design decisions. Most notably in areas subject to NEM 3.0, energy production is especially important at certain hours of the year (6pm in September, for example). To mitigate the need for a large battery to store energy produced earlier in the day, users can use the system visualizer animation to ensure the system they’ve designed will be unshaded during these critical hours of the year. By selecting a specific time of the year and visually showcasing the shadows that are cast, installers can quickly and clearly justify design choices to their customer.


