Help Center Pre-Design
How To Upload Interval Usage Data
Published on 19 May 2023
The guide below outlines the process of uploading interval usage data (hourly or 15 minutes) to your Solargraf project.
Homeowners can retrieve interval usage data (meter data) from utilities or OEMs, but the format of this data varies widely. Solargraf offers flexible options for users to upload this interval usage data.
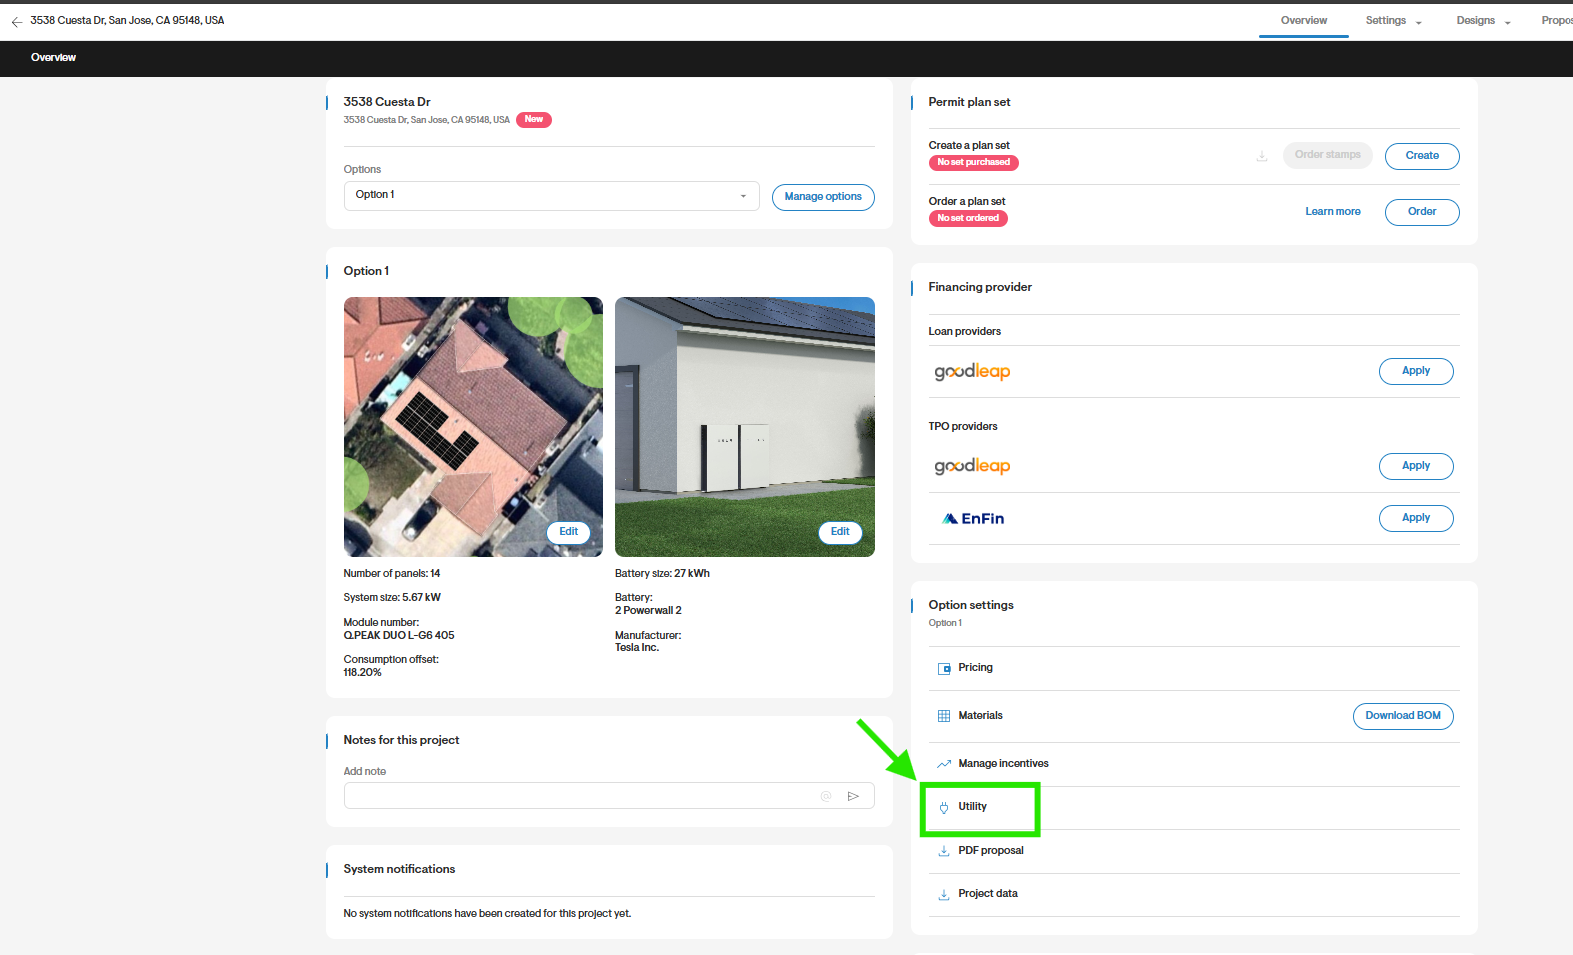
Go to Utility Settings
Start by navigating to the Utility settings found on your Solargraf project.
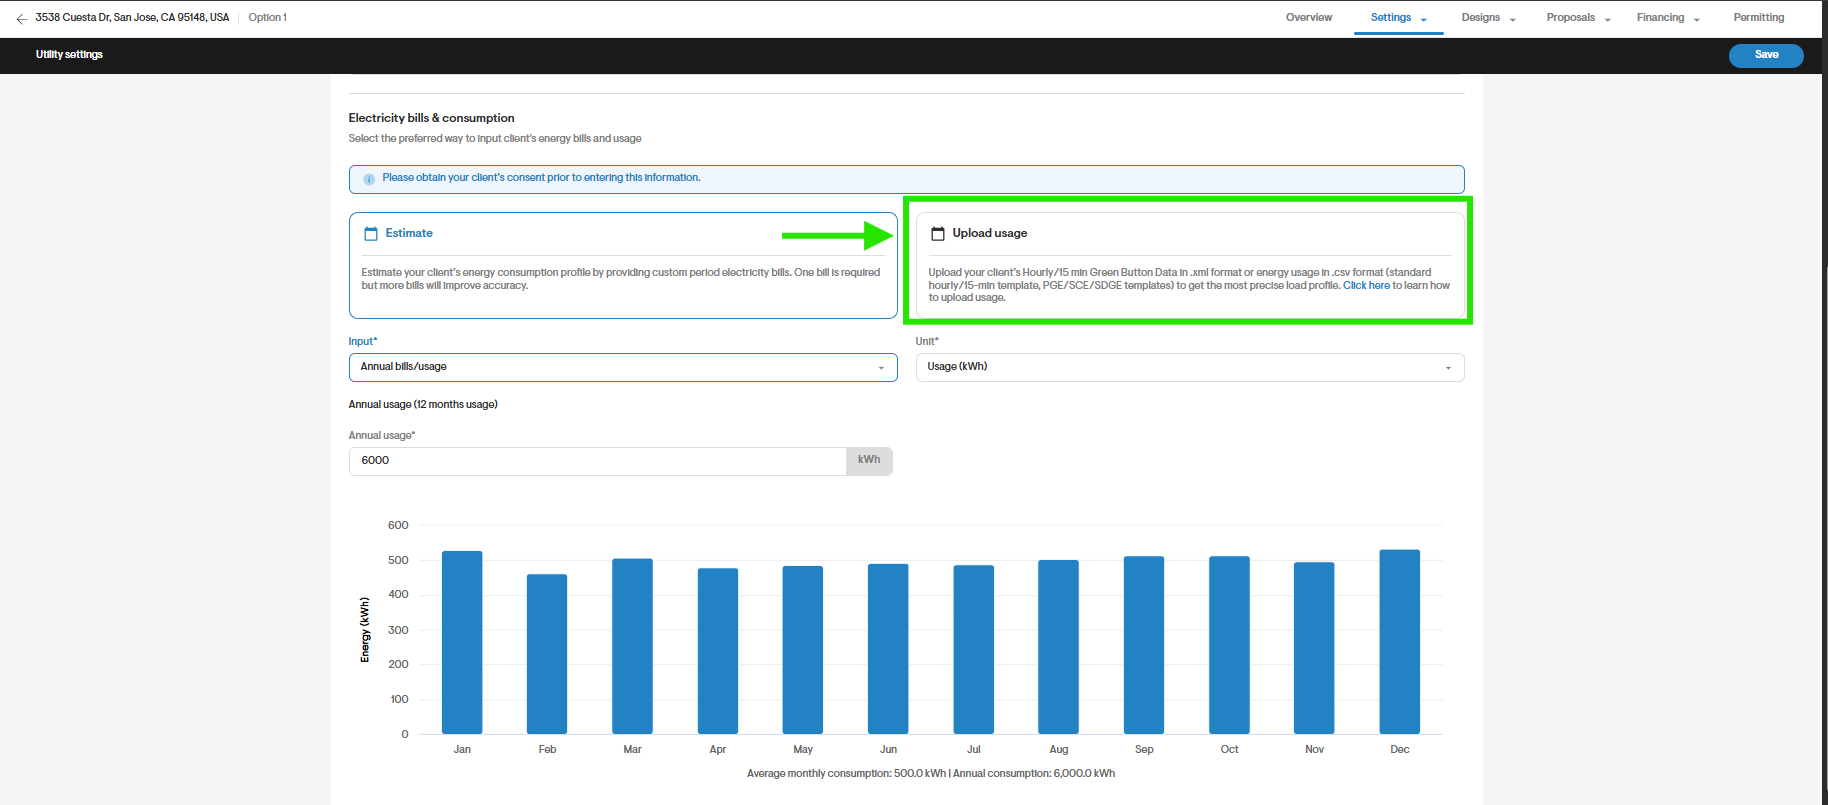
Select Upload Usage
- On the Utility Settings page, under Electricity bills & consumption, select Upload Usage.
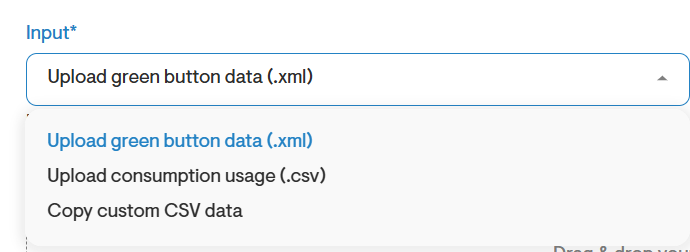
Select the Input type
- Select the Input type based on the usage data format available to you. Solargraf offers three options for performing the upload action.
Option 1: Upload green button data as .xml format
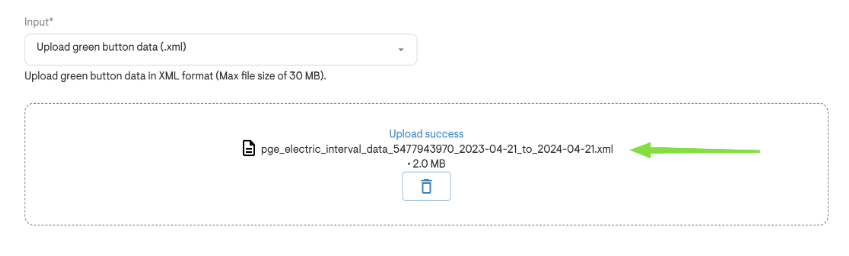
The standard green button data is available in the .xml format. You can download these .xml files from the utility website and upload them directly to Solargraf using the Upload green button data (.xml) option.
Note: Please upload the .xml file directly without opening or formatting it. Sometimes, opening and then re-saving the file might corrupt the format, leading to errors during the upload process.
Option 2: Upload usage data as .csv format
If you have usage data in the form of a .csv file (Excel format), please select this option.
Note: Solargraf supports direct upload of CSV files received from utilities such as PG&E, SDGE, and SCE in California. If you have files from these utilities, you can skip the template and directly upload them to Solargraf. For other CSV files, please follow the steps below.
Download the standard Solargraf template
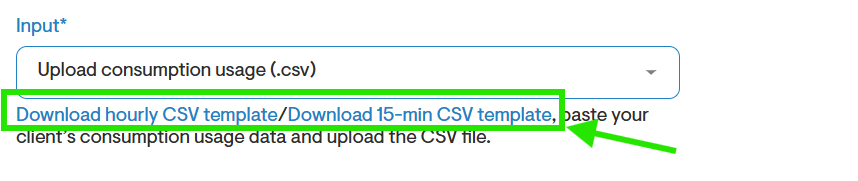
Download the Solargraf template for .csv. Choose the template that matches the interval frequency of your data (15-minute or hourly).
Copy your usage data to the template
Open the downloaded .csv template and paste your usage data. Ensure that the content of the copied data aligns with the timestamps of the .csv template.
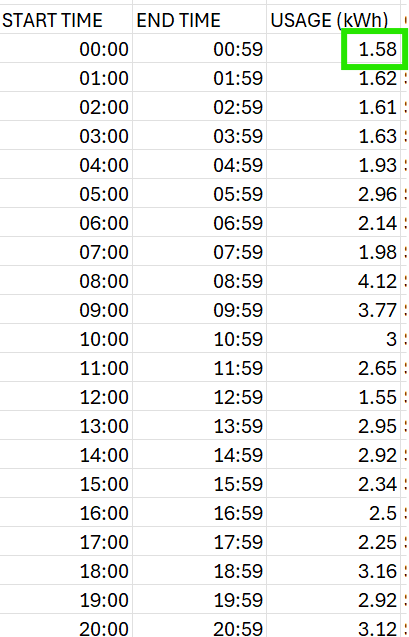
If you don't have data for the entire year, only copy the timestamps for which you have data and leave the rest blank.
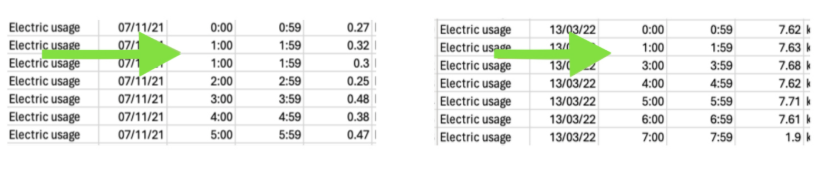
Be mindful of the DST data, make sure to eliminate the duplicate hour in November and leave the missing hour in March empty. Please refer to the example below where the PG&E (California) usage data has a DST offset and needs correction.
Upload the completed CSV template file to Solargraf
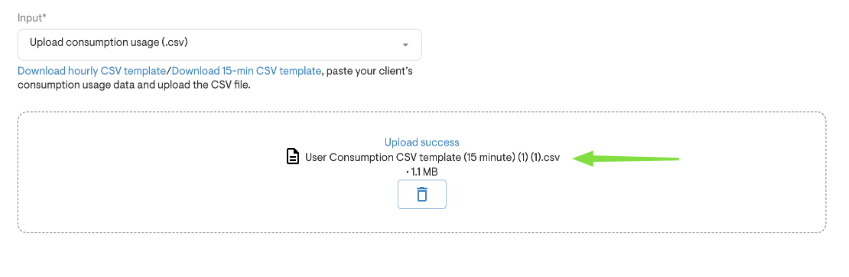
Save the completed .csv template and upload it to Solargraf using the upload box as seen below.
Option 3: Copy/Paste usage data directly
Select this option if you have usage data that can be directly copied to the clipboard and you prefer not to use the .csv template or make adjustments. This method offers greater flexibility if the usage data does not conform to any of the standardized templates.
Select the “Copy custom CSV data” option
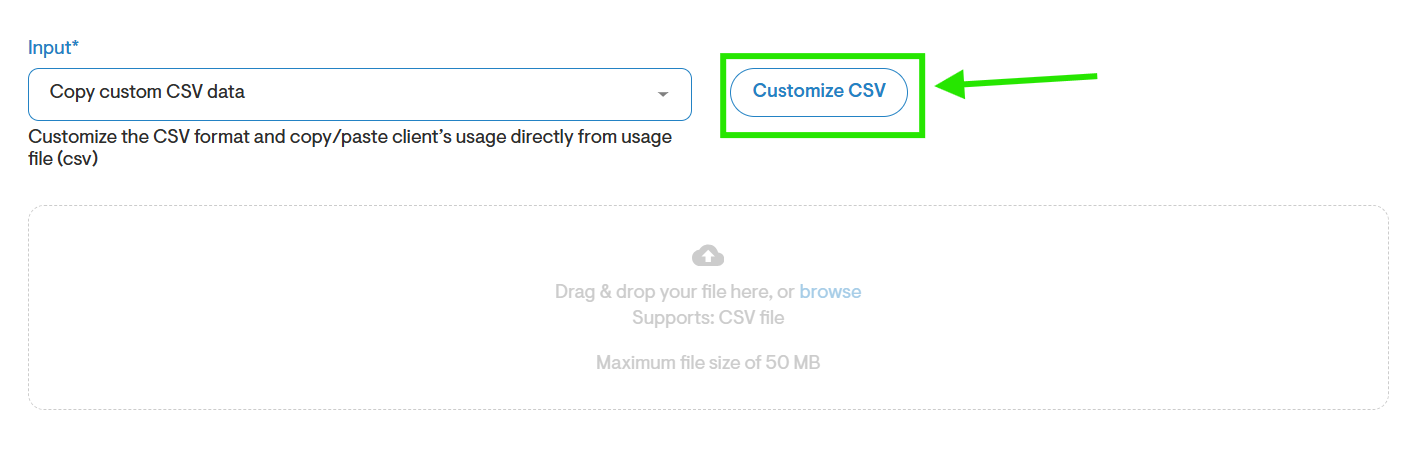
Select the Copy custom CSV data in the Input dropdown
Click the Customize CSV button.
Choose the right input selections
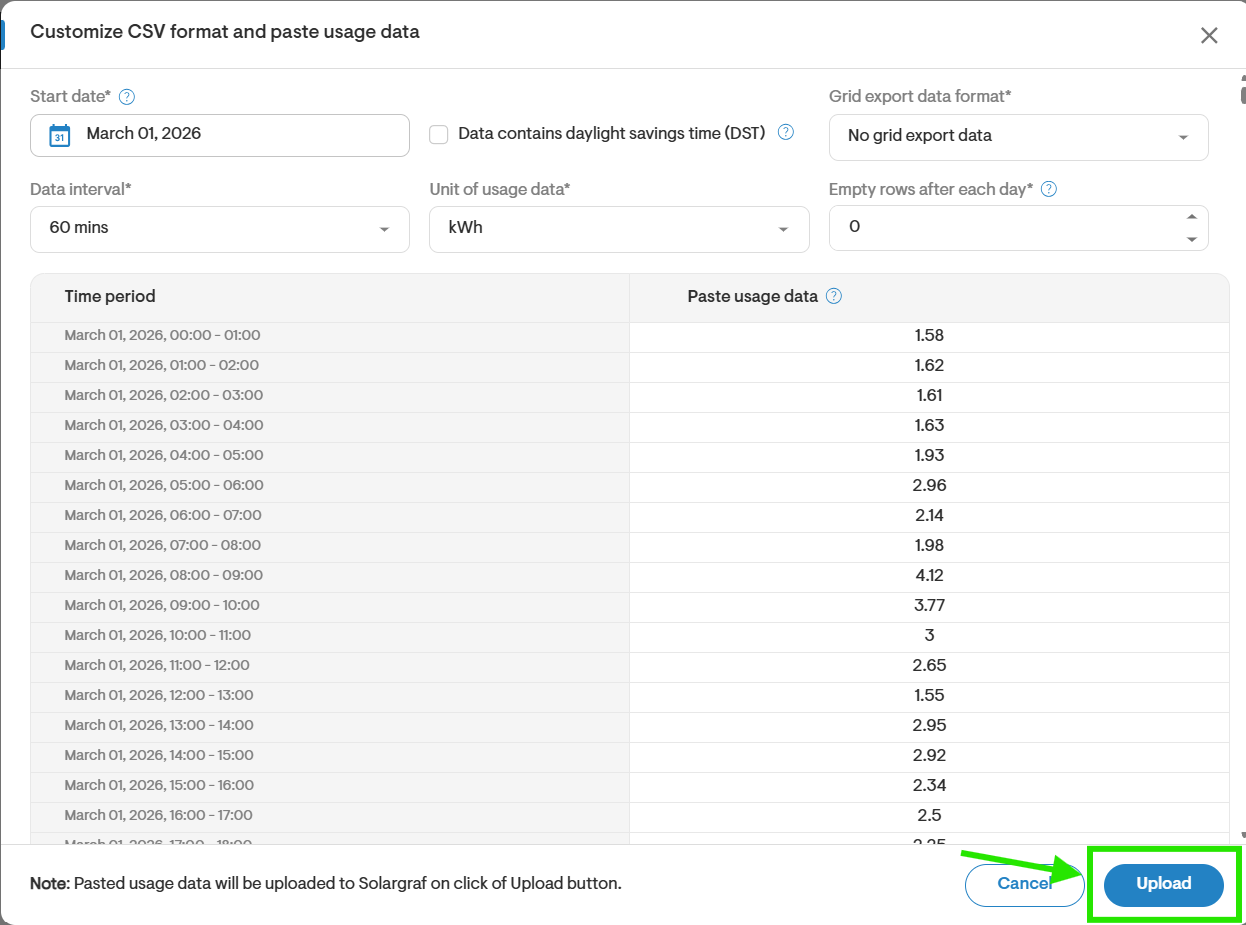
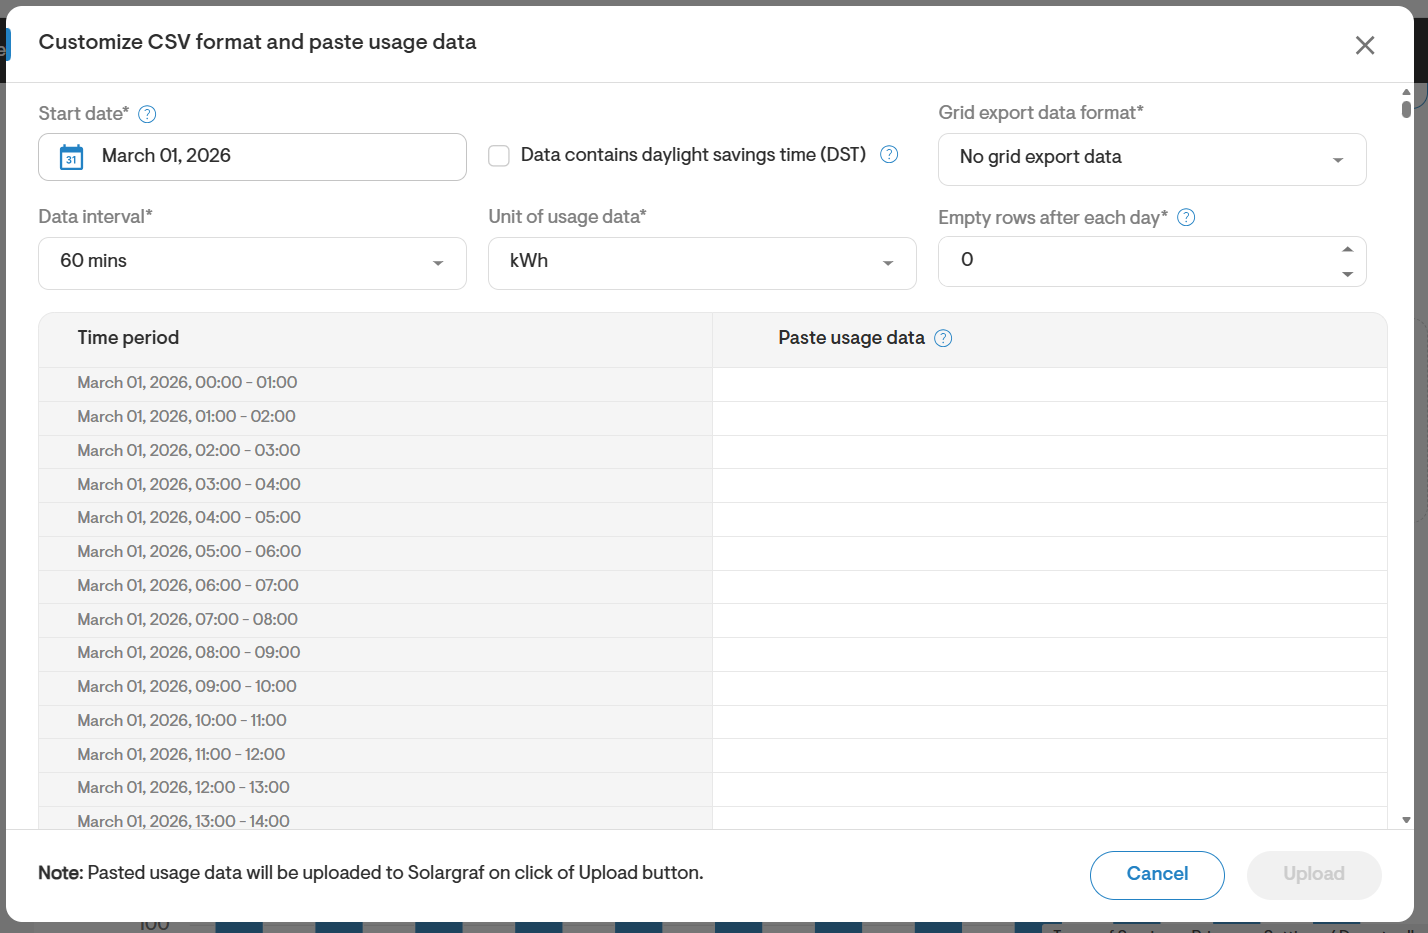
Select the appropriate input selections based on the usage data you are copying to Solargraf.
Start date: This is the date from which the usage data begins. Select any custom date, and Solargraf will automatically create timestamps for copying one year’s worth of data starting from the start date.
Data contains daylight savings time (DST): Check this option if the usage data includes a DST offset. Solargraf will adjust the offset for you when creating the timestamps.
Data interval: Choose the interval frequency of your data. Options include '15 minutes' and '60 minutes'.
Unit of usage data: Select the units in which your data is captured. Available options include ‘mWh’, ‘Wh’, ‘kWh’, and ‘MWh’.
Empty rows after each day: Select this option if there are empty rows between each 24-hour interval in the usage data. This will create the necessary empty rows between the timestamp tabs.
Paste and upload your data to Solargraf
To copy the entire data from your file to the clipboard (Ctrl+C or Cmd+C), select the first row in the table, and paste the data (Ctrl+V or Cmd+V). Finally, click on the upload button to process the data.