Help Center Design Tool
Heatmaps
Published on 9 Jun 2023
The following guide provides information on the heatmap feature in Solargraf's 3D design tool.
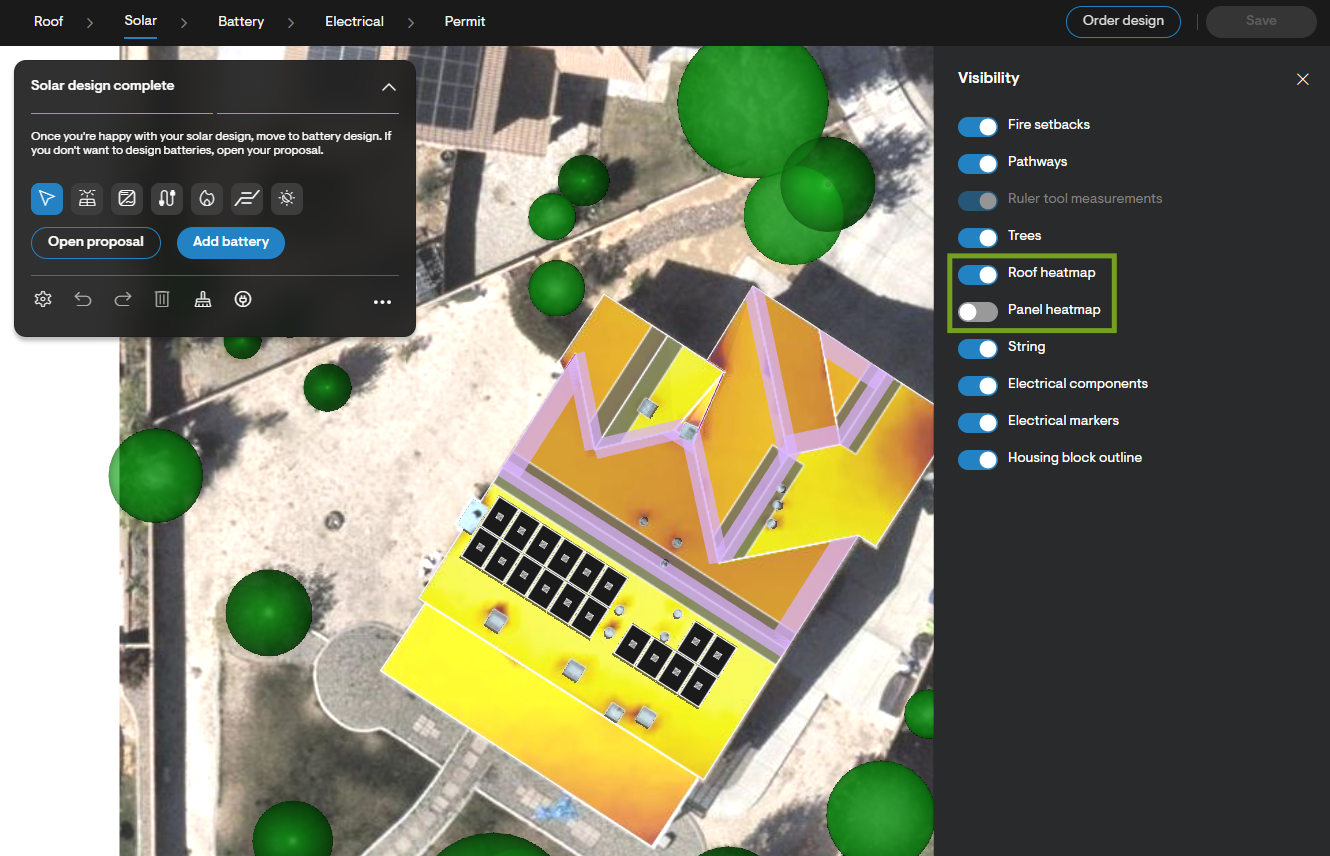
When deciding where to add panels for the solar design, the roof heatmap can make it easier to quickly assess which parts of the roof receive the most sunlight. Brightly colored areas will have higher Total Solar Resource Fraction (TSRF) values, while darker areas encounter more shading. Panels placed where the heatmap is bright white or yellow are therefore able to produce more energy throughout the day than ones placed where the heatmap is dark orange or purple.
Roof shading
Whenever a user enters solar design from roof design, roof shading will be calculated automatically. This will reoccur any time the user makes subsequent changes to the roof design (including changes to obstructions and trees).
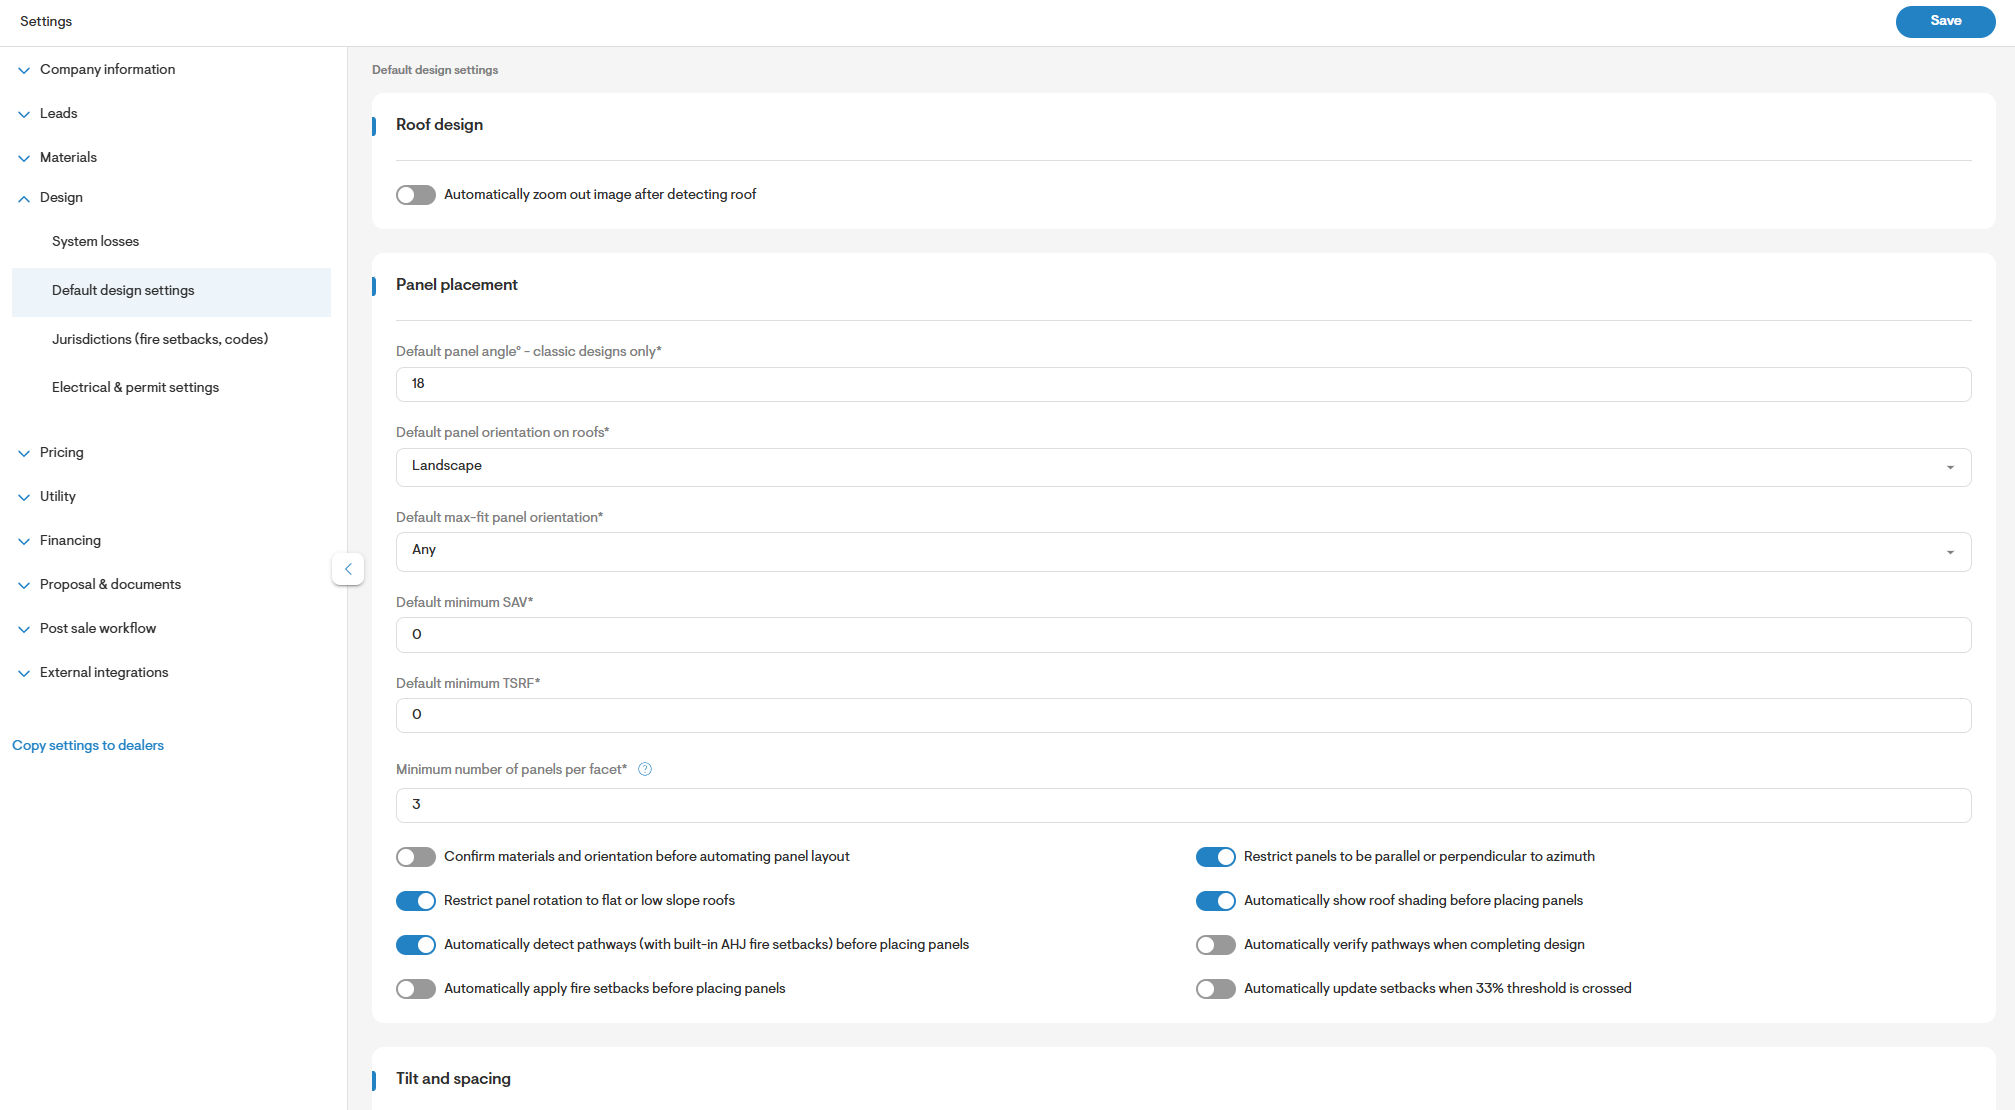
Depending on the user’s settings, this heatmap will either be shown or hidden by default. To make the heatmap visible by default, the toggle labeled “Automatically show roof shading before placing panels” in default design settings must be enabled.
Panel shading
Additionally, a heatmap for all panel arrays is automatically generated any time the production estimate is calculated, but this are hidden by default.
Heatmap visibility
Once generated, you can show or hide the heatmap by opening the visibility menu and enabling/disabling the Roof heatmap or Panel heatmap toggle switches.