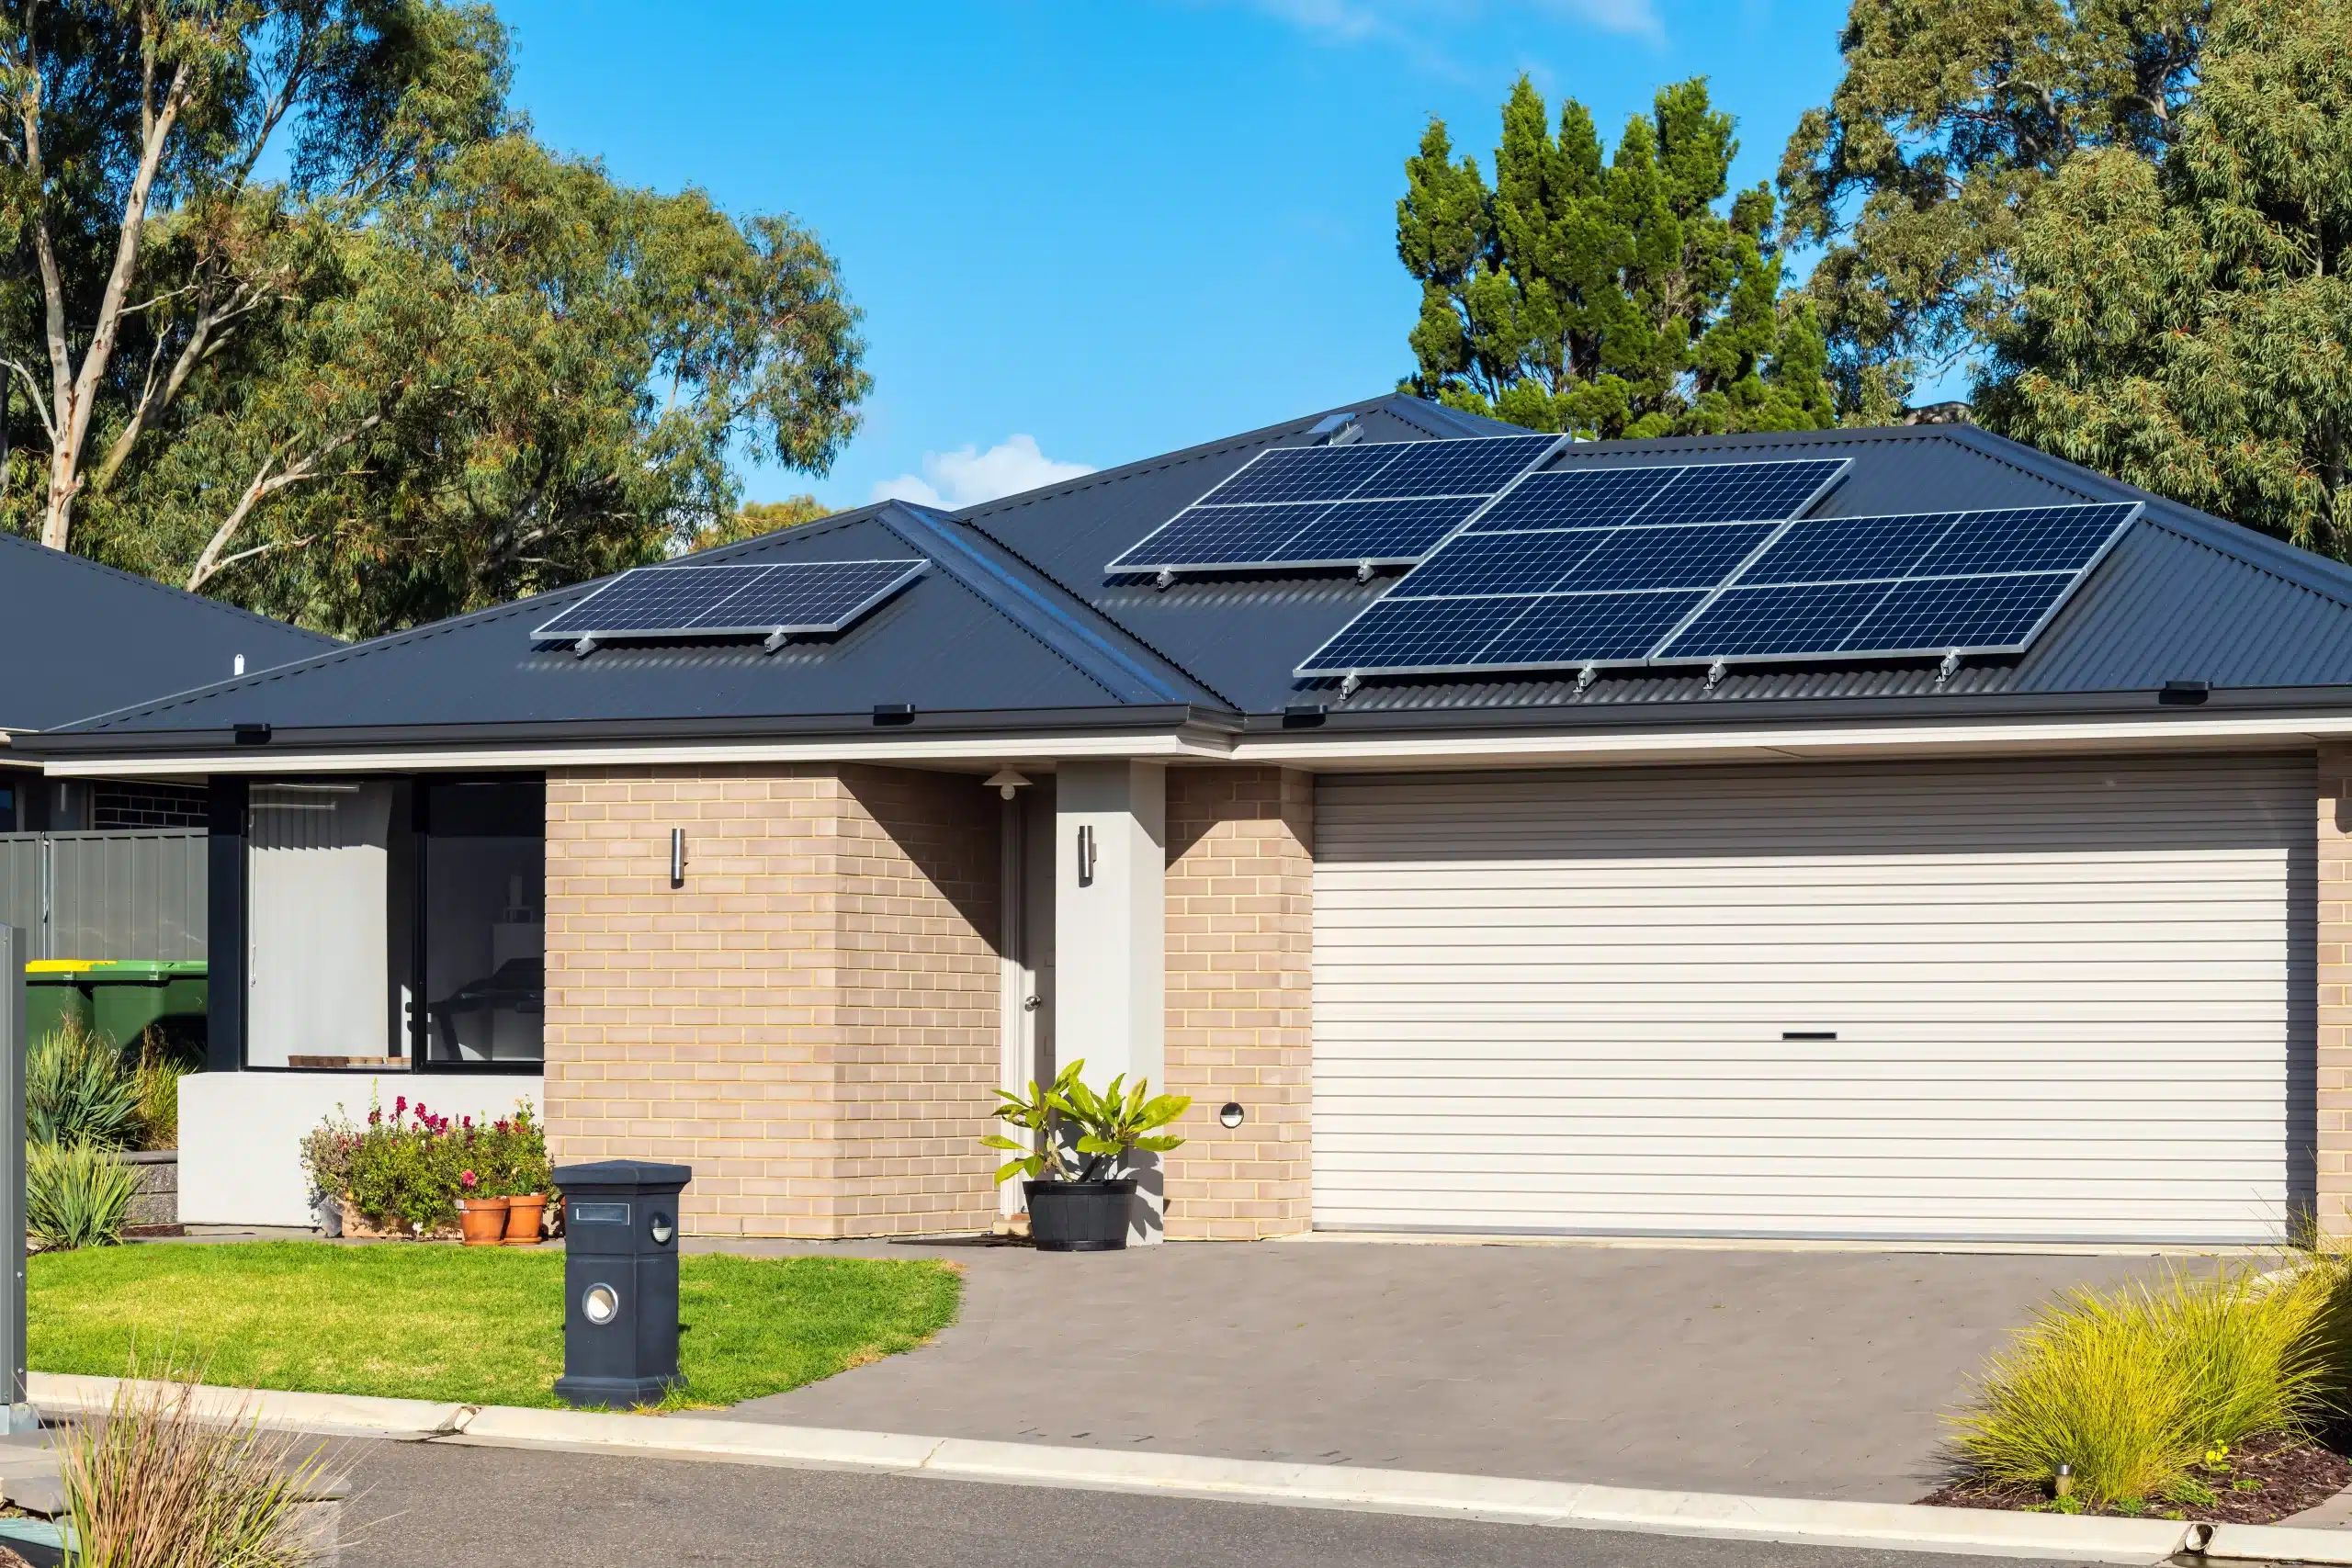
One of the crucial steps every installer follows while creating a solar or storage installation project proposal is the solar design. Solar design refers to the optimal placement and layout of solar panels on building roofs calculating system capacity, considering multiple site conditions such as shading factors, roof orientation, and tilt, and optimizing overall efficiency. Precision in each of these elements of solar design is critical for an accurate proposal.
Shading analysis, which is one of these important site conditions, has a direct impact on production. It involves evaluating how shadows from nearby objects, like buildings or trees, and other roof facets affect the performance of solar panels. By considering factors such as sun angles and obstruction patterns, designers can optimize the placement of solar arrays to minimize shading and enhance overall energy production efficiency.
The annualized heatmap represents the Total Solar Resource Fraction (TSRF). TSRF is the most important value when considering how much energy a module will produce according to its location on the roof. This value is a combination of the Solar Access Value (SAV) – which describes, as a %, how much of the sun’s energy that could hit any part of the roof does land on the roof, owing to the impact of shade from nearby obstructions, trees or other roof facets – with the Tilt and Orientation Factor (TOF), which describes, again as a %, how much the roof’s tilt (pitch) and orientation (azimuth) differs from optimal conditions.
Solargraf Shading Predictions
The power of Solargraf lies in its proprietary shading engine, which simulates the sun’s path at each hour of the day throughout the year and leverages site-level weather data to calculate irradiance and Solar Access Values (SAVs) for each point on the 3D model (as seen on the right in Figure 1). Combined with system losses, these values are then used to obtain production estimates for solar modules placed on the roof, eliminating the need for time-consuming site visits. Further, it simulates the system over its lifetime and shows the estimated savings a homeowner may achieve by installing it.
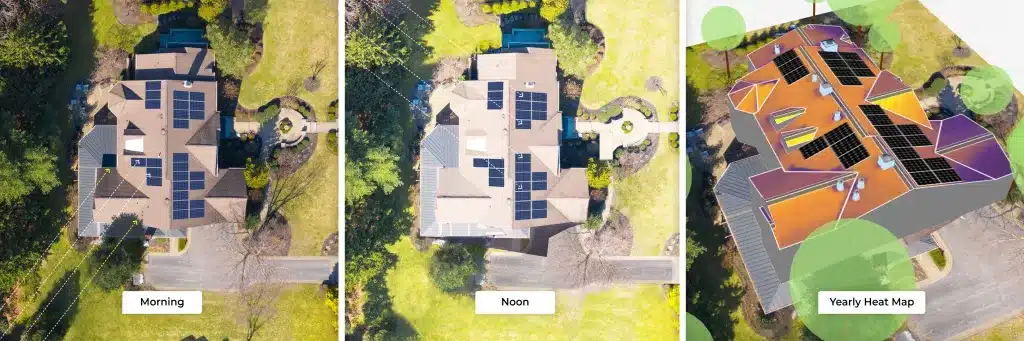
Figure 1. Overview of shading imagery in the Solargraf tool.
Enphase Energy worked with an independent 3rd party organization to validate the effectiveness of the shading engine developed in-house. As part of a larger Cooperative Research and Development Agreement with Enphase Energy that covered several projects, National Renewable Energy Laboratory (NREL) evaluated the statistical equivalence between SAVs calculated by Enphase Energy using their Solargraf software to perform remote shading analysis, and SAVs measured by NREL on-site using a Solmetric SunEye 210 shade measurement tool.
About the National Renewable Energy Laboratory (NREL)
The National Renewable Energy Laboratory (NREL), located in Golden, Colorado, is the United States’ primary laboratory for renewable energy and energy efficiency research and development. NREL works closely with several private partners to transfer advancing technological developments in renewable energy and energy efficiency technologies to the marketplace as part of its mission. It plays a crucial role in developing and validating various renewable energy solutions, including solar technologies.
NREL utilizes advanced testing and simulation methods to assess the performance of solar designs under different conditions, considering factors like shading, efficiency, and overall system effectiveness. Additionally, NREL may conduct on-site testing and validation of solar technologies to ensure their real-world viability.
In essence, NREL combines computational analysis, experimental testing, and research expertise to validate and improve solar designs and shading tools, contributing to developing more efficient and reliable solar energy systems.
NREL’s Evaluation – Comparing Solar Access Percentage Values
Methodology
NREL provided Enphase Energy with specifications of 81 total points across four residential rooftops split equally between Los Angeles, CA, and Denver, CO, respectively, with varying site conditions. NREL used annual SAVs calculated by averaging measurements taken with two Solmetric SunEye 210 devices for each of these 81 points based on the on-site measurements conducted in 2014. Enphase Energy provided NREL with annual SAVs estimated using their Solargraf software for each of the 81 points referencing older satellite data.
Results
Table 1 shows the test results to evaluate the differences in the SAVs estimated by Solargraf and the SunEye on-site measurements. The analysis results show that the annual SAVs provided by Solargraf were accurate to within ±2.39 SAVs for both locations, compared to the on-site measurements made by NREL, which is considered statistically equivalent.
| Table 1. Comparison of Annual SAV Estimates from Solargraf and On-Site Measurements for 81 Points on Rooftop Locations across Eight Houses | ||
|---|---|---|
| Equivalence Interval | Los Angeles | Denver |
| ±3 SAV | Yes | Yes |
| ±5 SAV | Yes | Yes |
| ±10 SAV | Yes | Yes |
Summary
These findings demonstrate that Solargraf can produce highly accurate shading predictions when compared to the real on-site shading values giving accurate TSRF values directly affecting the panel placements and production values. This will ensure your confidence in the proposal’s accuracy and provide your customers a quick and precise solution to their solar & storage needs!
The original report is available on the NREL website. You can access it here.
Boost your solar success: Get a NREL-powered, custom solar proposal today.
 United States
 Germany/Austria
 Brazil
 Netherlands
 Japan
Japan