
Every solar or storage installation project begins with a proposal issued by an installer to a prospective customer. To paint an accurate picture of how a solar PV and/or battery system can help a property owner achieve their goals – be that a reduction in utility bills, prioritizing self-consumption, maintaining power during a grid outage, or any combination of the above – the installer must begin by designing a system.
Every detail of the proposal – the materials used, payments for the system, future utility bills – is defined during this design phase or derived from data captured within the design. Most solar installation projects in the United States and Canada also require a permit issued by the local AHJ (Authority Having Jurisdiction) – typically a local building department – before installation and commissioning.
Thus, creating a design tailored to a potential new customer’s specific property is critical to winning that new business and honoring the benefits indicated on the proposal leading to the sale.
Historically, installers would typically visit the customer at their property and conduct a site survey to gather the information needed to create an accurate design and proposal. In the digital age, however, property owners and installers wish to refrain from taking the time for such activities. Thankfully, many tools are available to installers today that allow remote designs and automated proposals that remain specific to each property but can be delivered much quicker and at a lower cost than before.
Roof Design
Since most storage system designs depend upon the PV system installed (or to be installed) on a property, and since most (some ground-mounted systems excepted) depend upon the roof structure at the property in question, the design process typically begins by designing the roof.
Accurately designing a potential customer’s roof is essential if a PV design (and proposal) is to have any value. What may seem like minor details – such as the pitch (angle relative to the ground) of the roof or the position and height of a chimney – have a material impact on many factors relating to the PV design from the number of modules that can be installed on any given roof facet, all the way to the final estimated production (in kWh) of the PV system.
Errors in the roof design phase can cause delays to the permitting process or, in the worst case, cause delays on installation day – both at significant cost to the installer.
In Solargraf, all designs begin by locating the potential customer’s property (entering the address) and capturing an aerial image. These are typically gathered from external sources such as Nearmap or Google. The quality of the aerial image is paramount to the successful automation of the roof design. Thankfully, Nearmap offers imagery data covering 85% of the US population and typically captures imagery every six months to a resolution of 7.5cm per pixel.
Solargraf’s design tool allows users to detect or manually trace the roof’s outline on this aerial image. Users can also leverage AI-powered algorithms to convert the 2D (bird’s eye) outline into a 3D model. Solargraf does this by obtaining either Lidar data – 3D data that indicates the elevation of all objects within the perimeter of the aerial image (such as roof facets, obstructions, and trees) – or a digital surface model (DSM), which provides the same information using stereo photogrammetry – combining images taken of the same site but from different angles.
This information allows a Solargraf user to define the shape of the roof with facets divided, the pitch and azimuth (direction in which each facet faces, relative to North) of each facet, and the exact position, length and width or radius, and height of each obstruction, as well as the diameter and height of all surrounding trees.
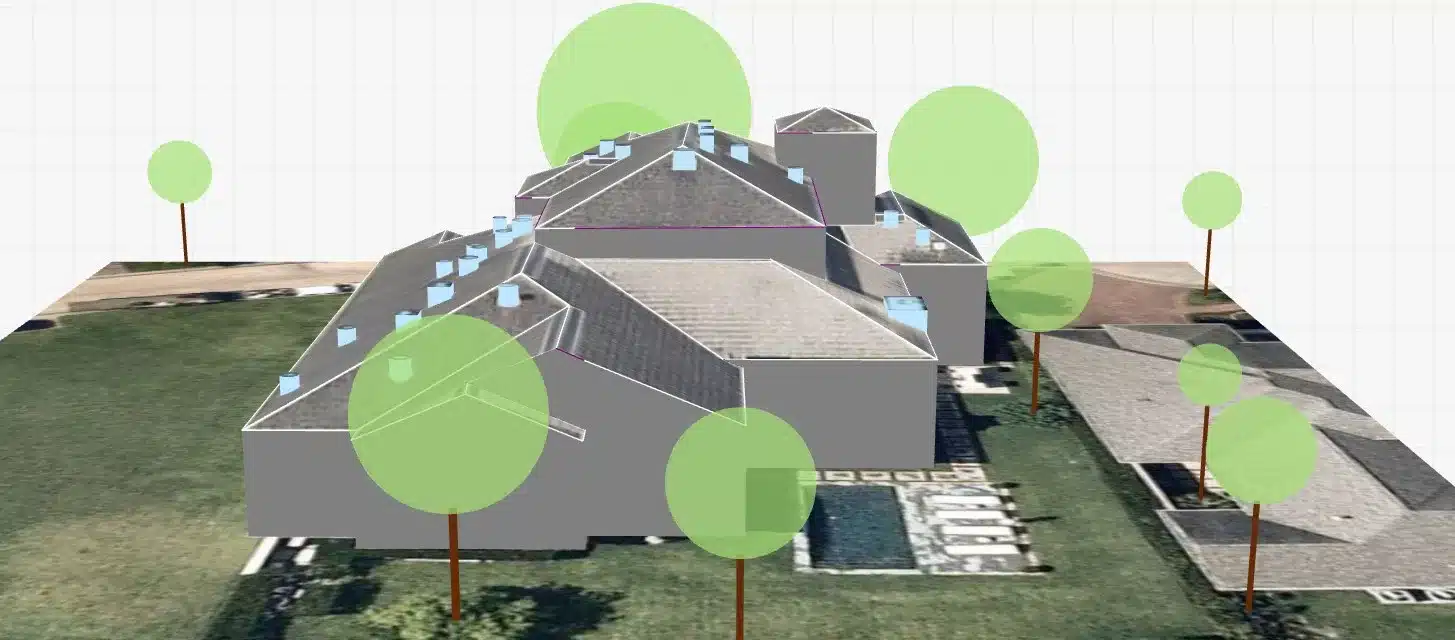
The result is a 3D model of the “site” – a term used to describe the roof and surrounding trees. Users should also model neighboring properties where there is at least some likelihood that those properties would shade any part of the customer’s roof during the day.
Users can achieve this model within seconds with this high-definition imagery and 3D data available.
Solar Design
Once the 3D model of the site has been generated, Solargraf allows users to create a PV module layout and calculate the estimated production of that system.
Some users may benefit from starting by generating a shading heatmap for every pixel on the roof. The annualized heatmap represents the Total Solar Resource Fraction (TSRF). TSRF is the most important value when considering how much energy a module will produce according to its location on the roof. This value is a combination of the Solar Access Value (SAV) – which describes, as a %, how much of the sun’s energy that could hit any part of the roof does land on the roof, owing to the impact of shade from nearby obstructions, trees or other roof facets – with the Tilt and Orientation Factor (TOF), which describes, again as a %, how much the roof’s tilt (pitch) and orientation (azimuth) differs from optimal conditions.
For example, in the Northern Hemisphere, modules placed on a roof facet facing due south (180 degrees) will produce as much energy as possible, all other factors disregarded. Modules placed on a facet facing due North (0 degrees) will produce the least possible energy when only considering the roof facet’s orientation. Thus, a south-facing facet has an orientation factor of 100%, while a North-facing facet has an orientation factor of 0%.
Similarly, the optimal tilt of the modules (regarding expected production) equals the site’s longitude. On a home in Minnesota – which lies close to the 45th parallel, halfway between the North Pole and the Equator – for example, modules placed at a 45-degree tilt relative to the ground would produce more energy than other modules placed at any other tilt.
In practice, most modules placed on pitched roofs (those whose angle relative to the ground in greater than 0) are placed “flush” with the roof – meaning their tilt relative to the ground equals the underlying roof facet. Thus, if the homeowner wanted the modules to be flush to the roof (as is typically the case), the roof would need to have a pitch of 45 degrees (often described as “12/12” by roofers) to score a 100% tilt factor.
Multiplying the orientation and tilt factor together gives us the TOF. Multiplying TOF with SAV gives us the TSRF.

Assessing the TSRF for each area on the roof can help guide a Solargraf user as to where to place the modules. However, the user needs to consider another important factor prior to creating a PV layout – the setbacks. These areas on the roof must be kept clear of modules as per the AHJ – typically, these are specific distances from various types of roof edges – 18 inches from a ridge or 12 inches from a rake, for instance.
The setbacks mandated by an AHJ are subject to change at any moment. Luckily, Solargraf maintains a database of AHJ records and setbacks for most areas in the US. Setbacks can be applied automatically to any 3D model and then manually adjusted if desired. Most users in Solargraf today will not even notice they’re there!
Now it’s time to place modules! Users can place modules manually by filling a roof facet or defining a specific area within each facet to be populated by modules. The user can then calculate the estimated production for the system they have designed and make alterations until they achieve the desired layout, estimated production and consumption or utility bill offset.

In Summary
Solargraf allows installers to design and quote solar projects with unprecedented speed and accuracy. Using Solargraf’s new 3D design tool will not only impress your customers and bring their solar project to life but it will also reduce the chance of last-minute design changes and ensure your confidence in the proposal’s accuracy!
There has never been a better time to try Solargraf, be sure to schedule your demo today!
Transform your solar proposal with ease! Discover our solar design and proposal services now!
 United States
 Germany/Austria
 Brazil
 Netherlands
 Japan
Japan