Help Center
Credit Usage Dashboard
Published on 28 Oct 2026
The Credit usage dashboard provides a centralized view of credit allocation, consumption, and utilization across projects, companies, and users. This dashboard helps you:
- Monitor credit allocation, purchases, usage, and remaining balance in one place
- Track credit consumption trends across residential and commercial projects
- Identify which users, dealers, and regions are consuming the most credits
- Understand how credits are being utilized between self design and service design workflows
- Improve subscription planning and forecasting through better visibility into credit usage
Accessing the dashboard
The Credit usage dashboard is available within the Solargraf analytics section. Navigate to Analytics > Credit usage dashboard to view it.
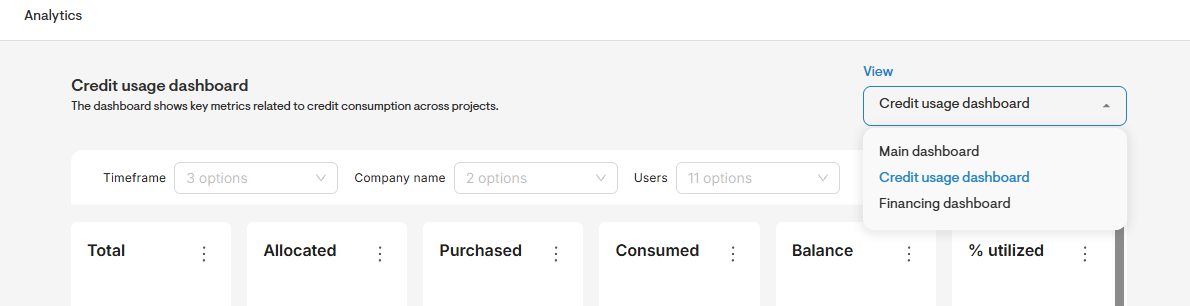
Filters
Use these filters to narrow the data shown across every chart on the dashboard:
| Filter | Description |
| Timeframe | Select a specific period or custom date range |
| Company name | Filter data for a specific company |
| Users | Filter data for specific users |
Filters apply globally across the dashboard, allowing you to analyze credit consumption by company, team member, or period without adjusting each visualization individually.
Tip: Use the Timeframe filter together with Company name or Users to identify consumption patterns, compare usage trends across teams, and understand how credit utilization changes over time.
Dashboard components
1. KPI summary cards
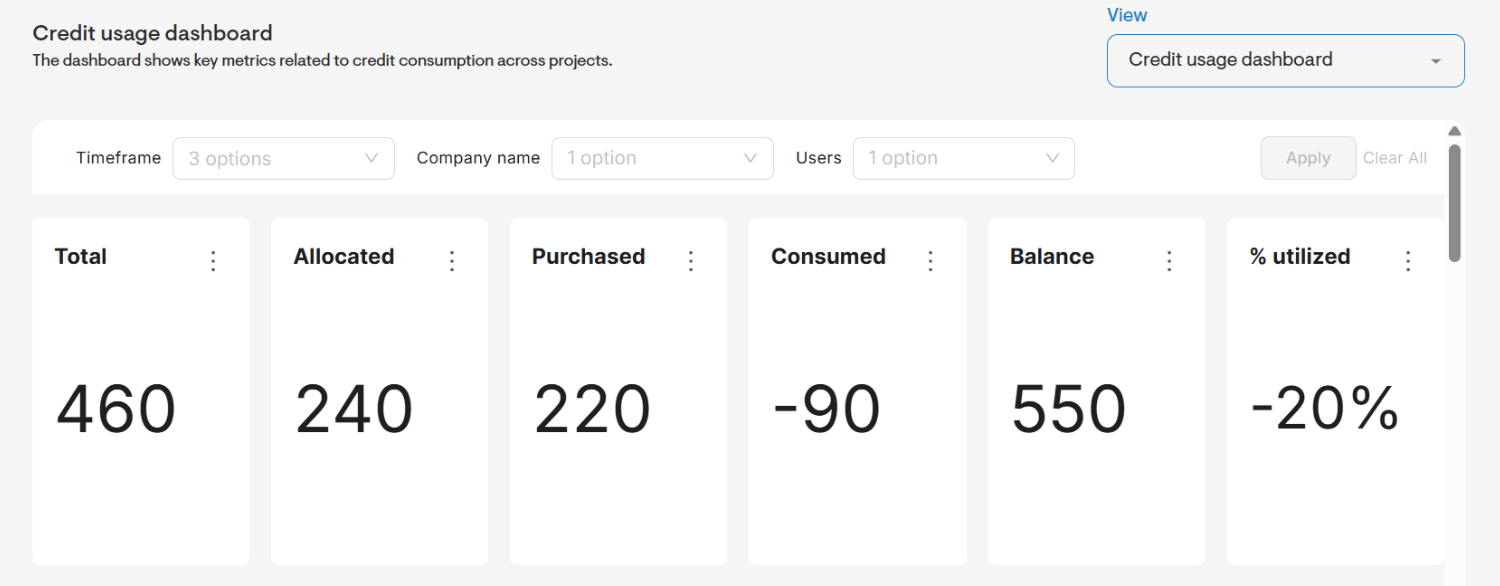
KPI (key performance indicator) cards at the top of the dashboard provide a quick snapshot of the account’s current credit position. Use these KPI cards to quickly understand your current credit position, monitor consumption levels, and determine how much credit remains available before additional credits may be required.
The dashboard includes the following KPI cards:
- Allocated: Displays the total credits allocated to the account
- Purchased: Displays the total credits purchased or added to the account, excluding the ones already allocated
- Total: Displays the total credits, calculated as: (Allocated credits + Purchased credits)
- Consumed: Displays the total credits used across projects
- Balance: Displays the remaining credits, calculated as: (Total credits − Consumed credits)
- % utilized: Displays the percentage of available credits that have been consumed, calculated as: (Consumed credits / Total credits) × 100
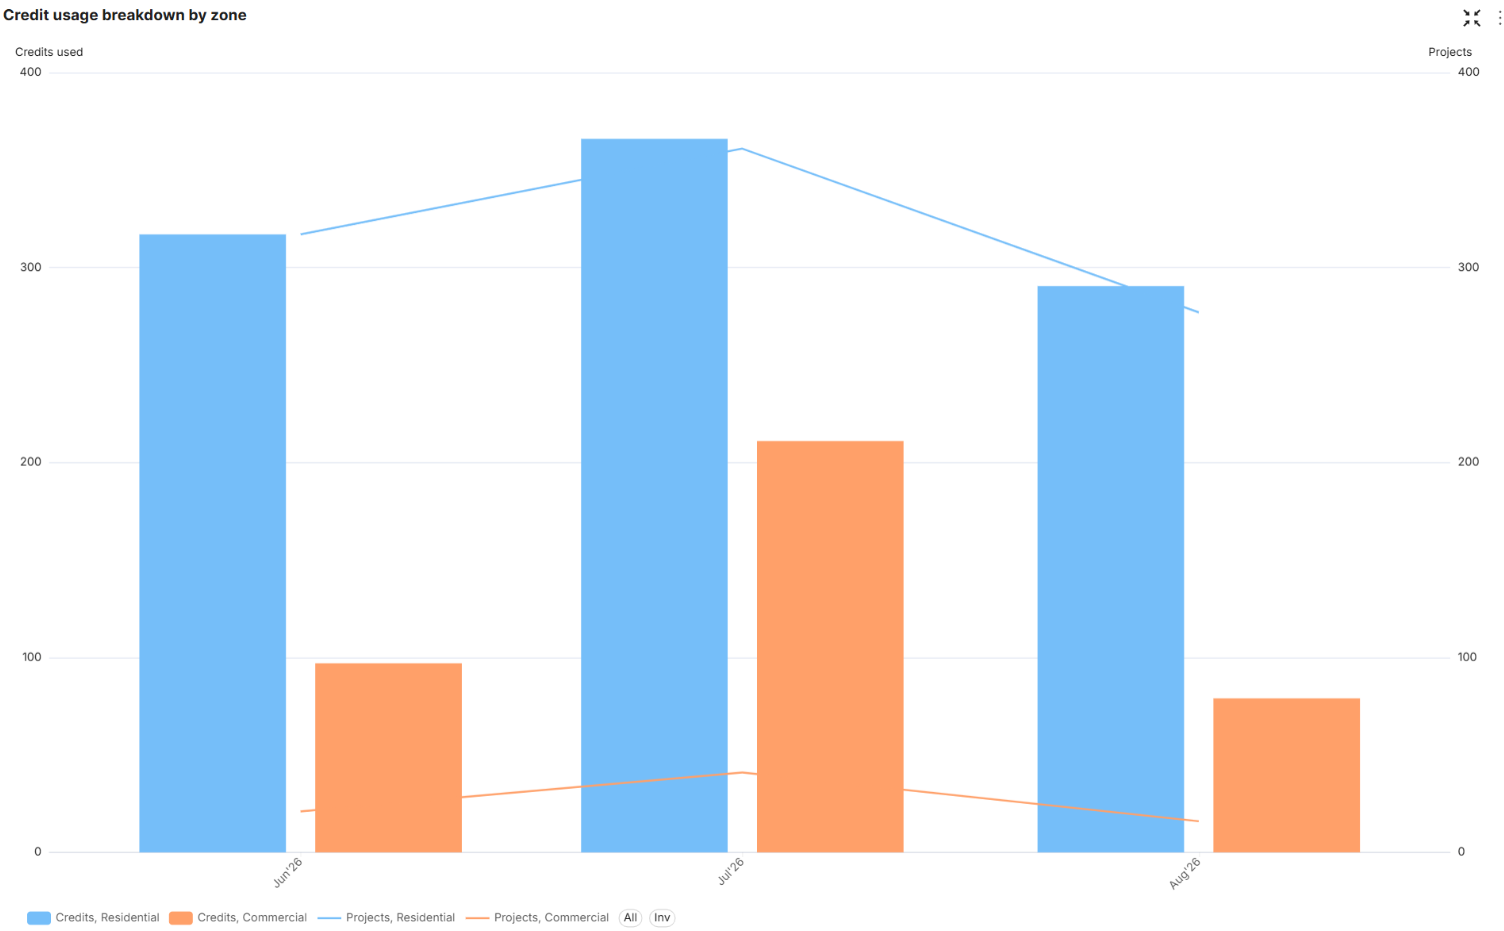
2. Credit usage breakdown by zone
This dual-axis chart shows credit usage and project creation trends across zones over the subscription period. The bar chart displays residential and commercial credits consumed, while the dotted line chart displays residential and commercial projects created. Use this chart to compare credit consumption against project volume and determine whether credit usage is increasing proportionally with project activity across residential and commercial zones.
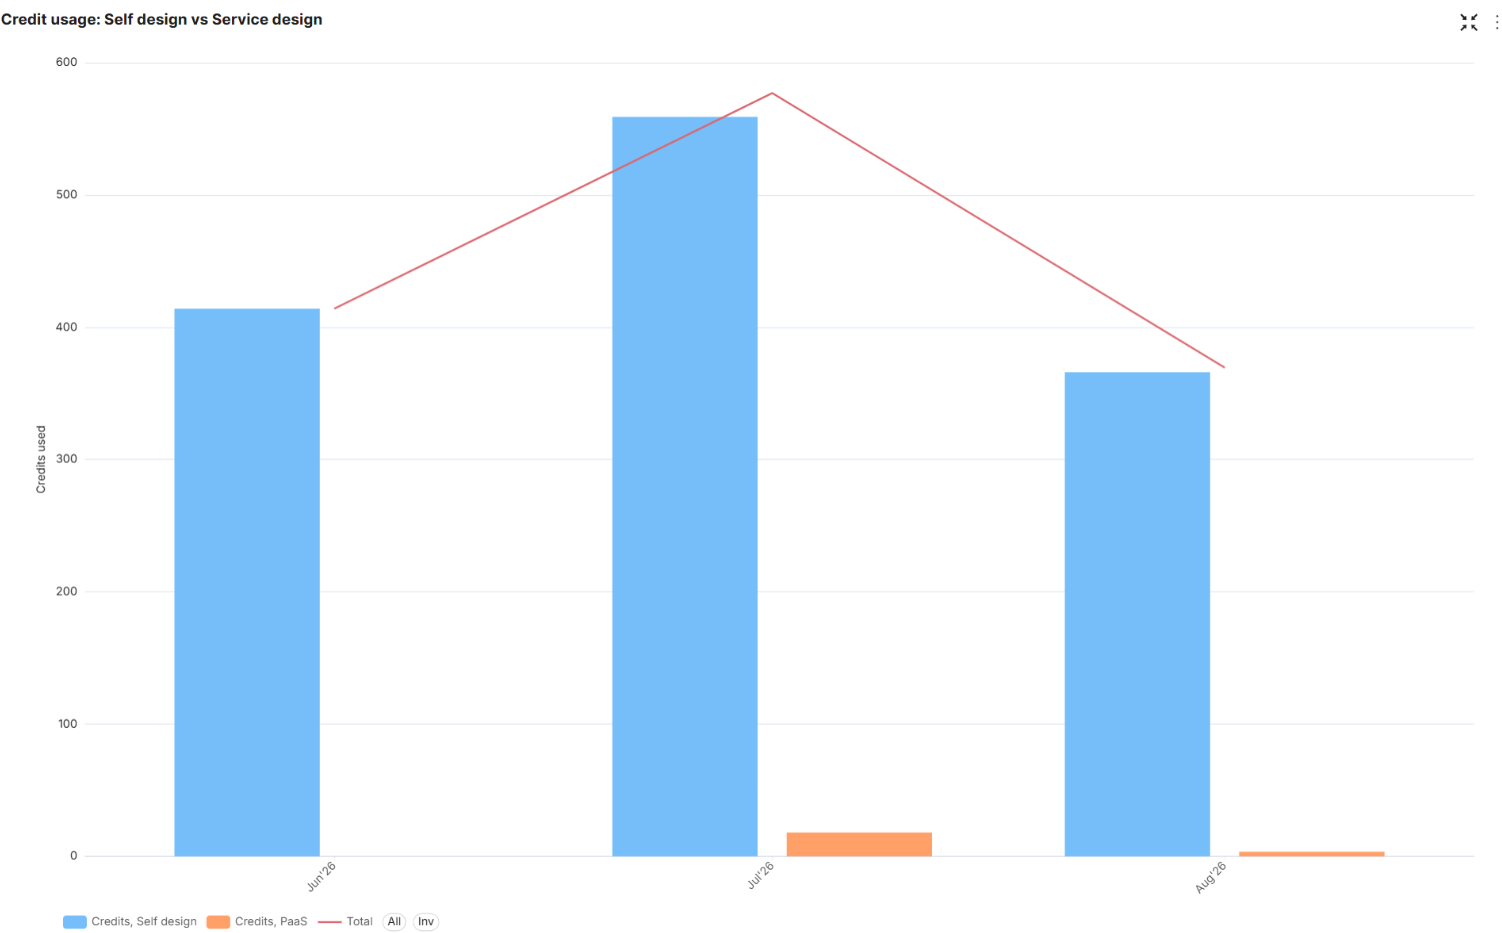
3. Credit usage: Self design vs Service design
This clustered column chart compares credits consumed by self design and service design projects over the subscription period. The columns represent credits used for each design type, while the dashed trend line represents total credits consumed during the selected timeframe. Use this chart to understand how credits are distributed between self design and service design workflows and identify changes in usage trends over time.
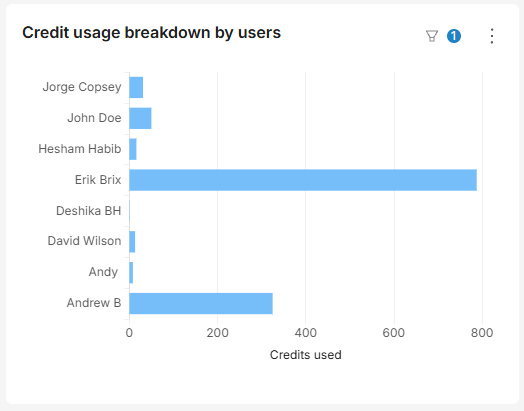
4. Credit usage breakdown by users
This horizontal bar chart displays the top 10 users based on credits consumed during the selected timeframe. Each bar represents a user and the total credits used. Use this chart to identify power users, understand usage patterns across team members, and monitor credit consumption at the individual user level.
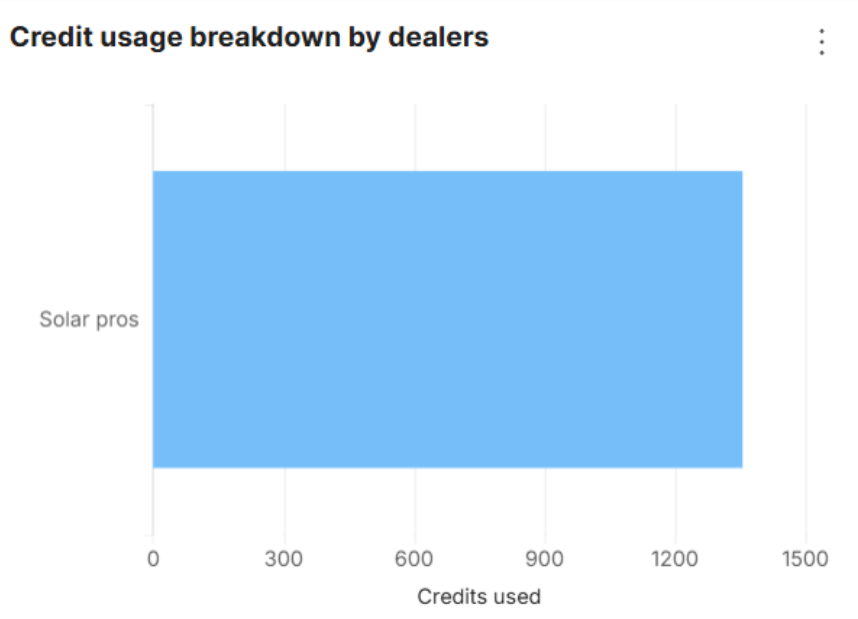
5. Credit usage breakdown by dealers
This horizontal bar chart displays credit consumption across parent and dealer accounts over the subscription period. Each bar represents a dealer and the number of credits used by that dealer. Use this chart to identify which dealers consume the most credits and monitor adoption and activity levels across your dealer network.
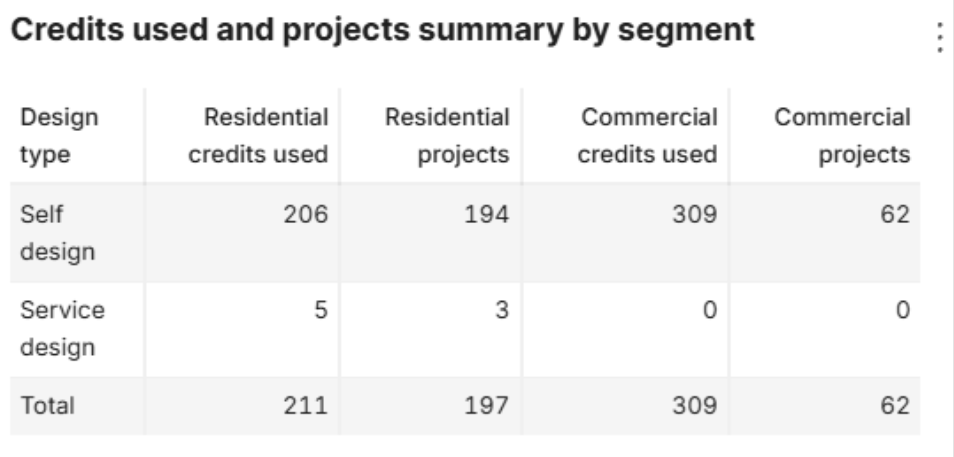
6. Credits used and projects summary by segment
This summary table provides a consolidated view of credits used and projects created by segment. Columns are grouped as Residential (Credits | Projects), Commercial (Credits | Projects), and Total (Credits | Projects), while rows include Self design, Service design, and Total. Use this table to compare project activity and credit consumption across business segments and design workflows in a single view.
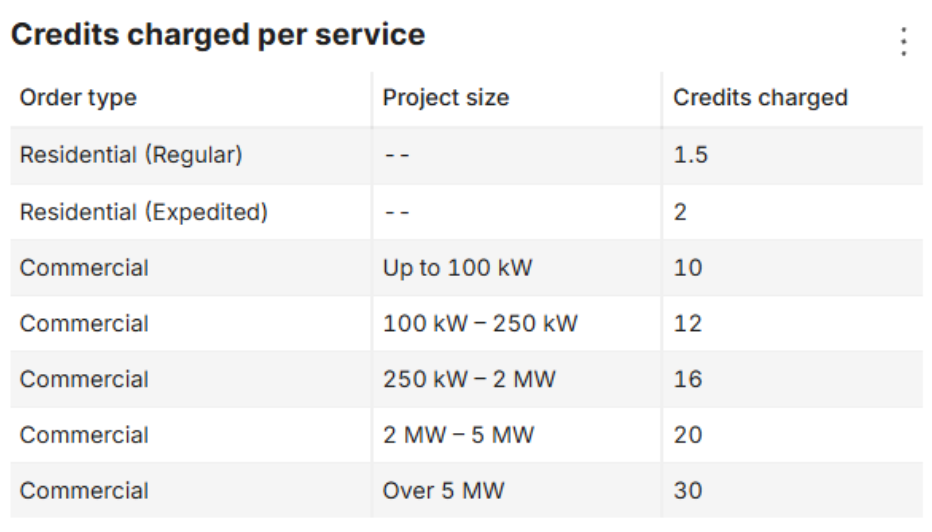
7. Credits charged per service
This legend explains how credits are charged based on order type and project size for service design projects. It helps users estimate the number of credits required for upcoming service design requests, forecast future credit needs, monitor consumption more accurately, and avoid unexpected credit shortages.
Summary
The Credit usage dashboard provides a comprehensive view of how credits are allocated, purchased, consumed, and distributed across your organization. We recommend reviewing the dashboard regularly to proactively manage subscription usage and avoid unexpected depletion of available credits.